NAS Systems Status Website User Guide
| 1: | Overview Window |
| 2: | System Box Detail |
| 3: | Node Utilization Graph |
| 4: | CPU Usage Toggle |
| 5: | Host Group Section |
| 6: | Filesystems Section |
| 7: | Expanded View Window |

(1) Overview Window
|
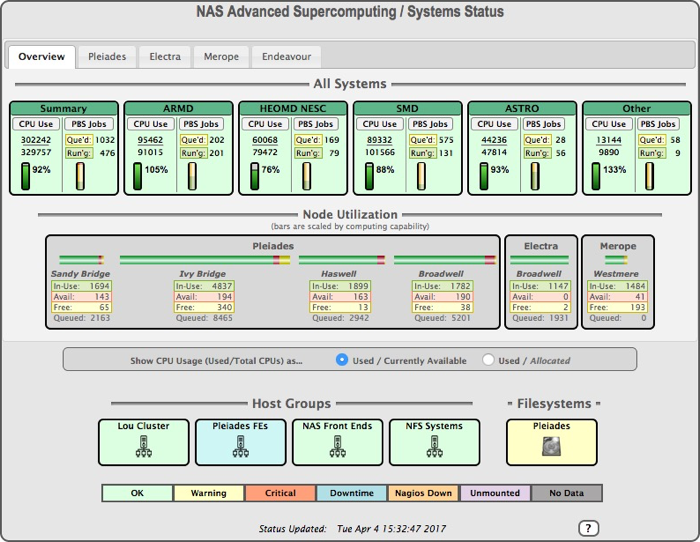
| The systems status window shows resource usage by mission directorate across all of the major HECC compute systems. The default view is the Overview panel, which shows combined data for these systems. The other tabs can be selected to view data for just one compute system. CPU usage and status of PBS jobs metrics are shown for each mission. The Summary box shows this data for all missions combined. (For Pleiades, this data is shown for the special run queues, Devel and GPU, as well.) Node utilization graphs show relative usage of the different node models for each of the compute systems. (Note that Endeavour currently does not include a node usage graph.) Color is used to indicate overall state in the boxes (generally OK, warning, critical, or in scheduled downtime), while rollovers are used to show greater detail. When you're viewing one of the individual system tabs, clicking on any of the box titles launches a window with expanded detail. The "Host Groups" section displays information on various ancillary system suites in rollover popups, while the "Filesystems" section shows the status and amount free of home and remote-mounted filesystems on Pleiades. |
(2) System Box Detail
|
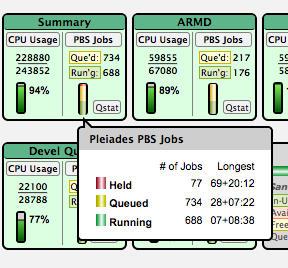
| The "PBS Jobs" section of each summary and mission box can be moused over to show more jobs data. Mousing over the "CPU Usage" section shows the same data in an expanded format. Individual system tabs (i.e. all tabs except the Overview panel) also include a "Qstat" button on the boxes. Clicking "Qstat" launches a window of qstat output specific to each mission (or to all missions if the box is the Summary box). |
(3) Node Utilization Graph
|
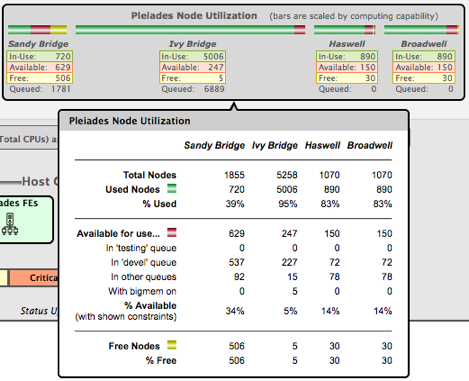
| The node utilization graph shows node usage for the various compute node architectures. The bars are scaled by the relative computing capabilities of these node classes to show their relative contributions. For each classes, counts of nodes are shown for the ones that are 1) in-use, 2) available on a limited basis, and 3) completely open and free for use. "Available on a limited basis" means the nodes are conditionally open for use as long as the jobs using them adhere to some criteria: either in one of various queues, with the "bigmem" flag set on, or with time constraints that don't interfere with reserved use later. |
(4) CPU Usage Toggle

|
CPU usage is shown as the fraction of the CPUs in-use / total CPUs. The value for "total CPUs" can be defined as either:
|
(5) Host Group Section
|
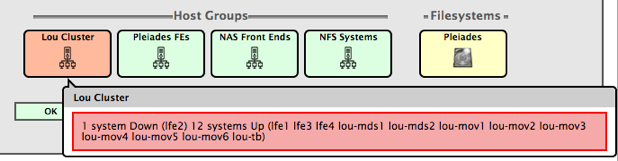
| The "Host Group" section is used to show the status (up, down, or in dedicated downtime) of these front-end and support system suites. Rollover popups show the status of individual systems. |
(6) Filesystems Section
|
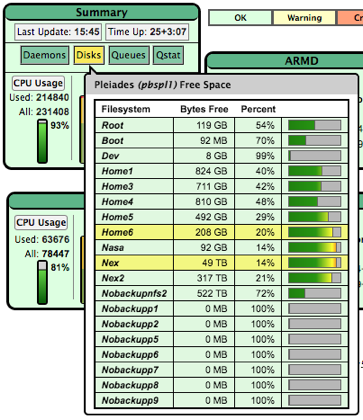
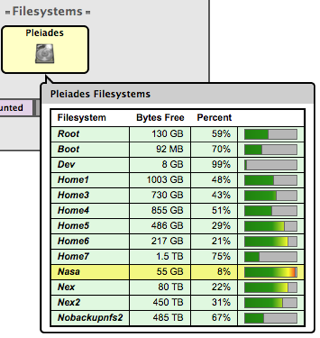
| The "Filesystems" box rollover shows the amount of space free, as well as if it is unmounted or inaccessible. |
(7) Expanded View Window
|
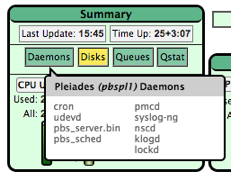
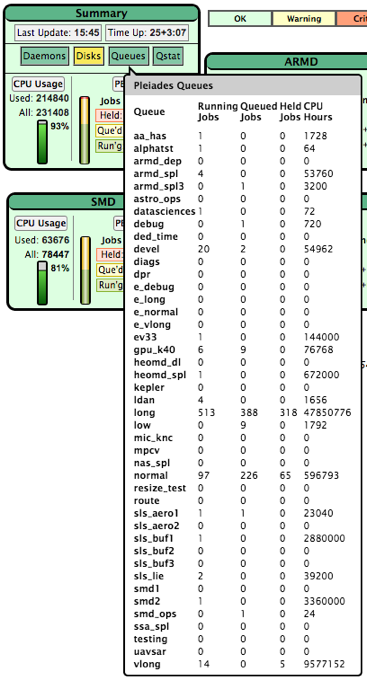
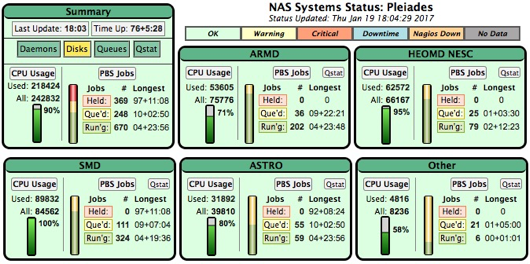
| Clicking on any of the compute system box headers in the main window launches this window showing the system in expanded detail. In the Summary box, rollovers show data for daemons, disks and queues, while clicking on the Qstat button launches a Qstat window (mission-centric or overall for the Summary box). Colors in this row of boxes indicate status of these facilities. | |||
|