Media Gallery

High-resolution images and videos such as those shown at SC11 help scientists and engineers better understand their simulations and experimental data, and make new discoveries for NASA missions.

Click on a thumbnail to view the associated caption and image. Then, use the previous/next arrows to navigate through the images in each theme area. Click on a video thumbnail (marked by the superimposed "play" icon) to view the video and caption. Please note: Some of the videos are several megabytes in size and may take a few moments to load.

Aeronautics
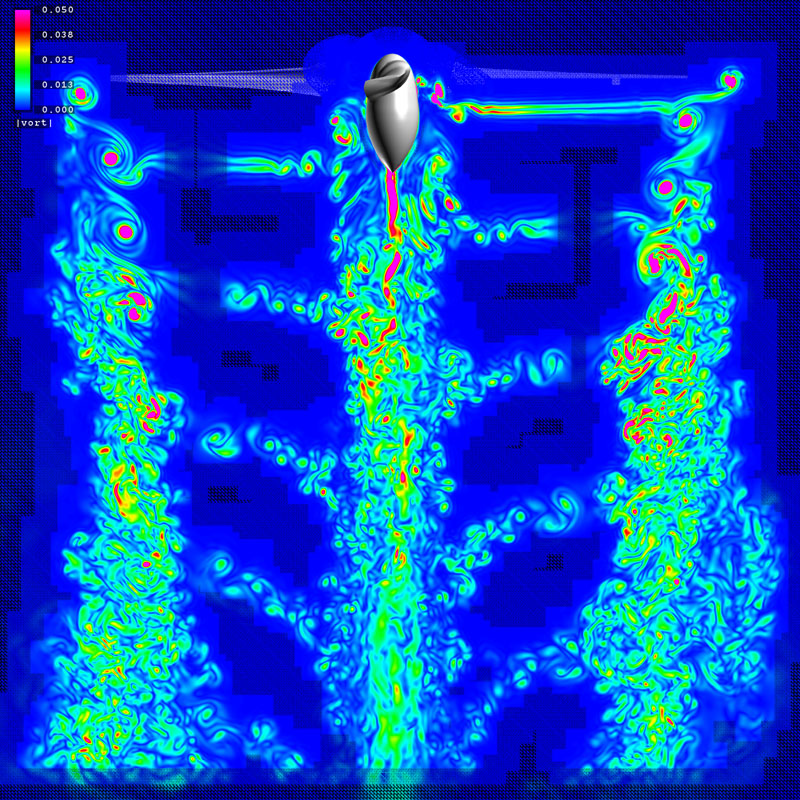
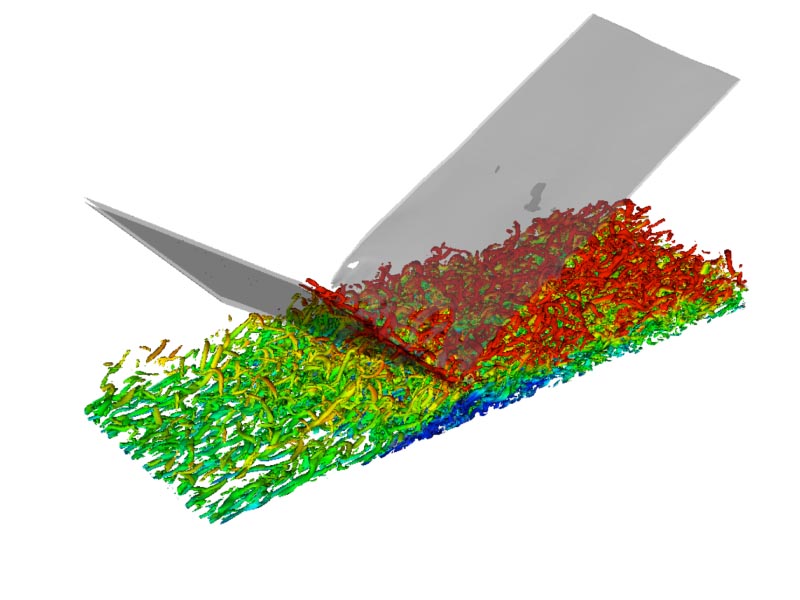
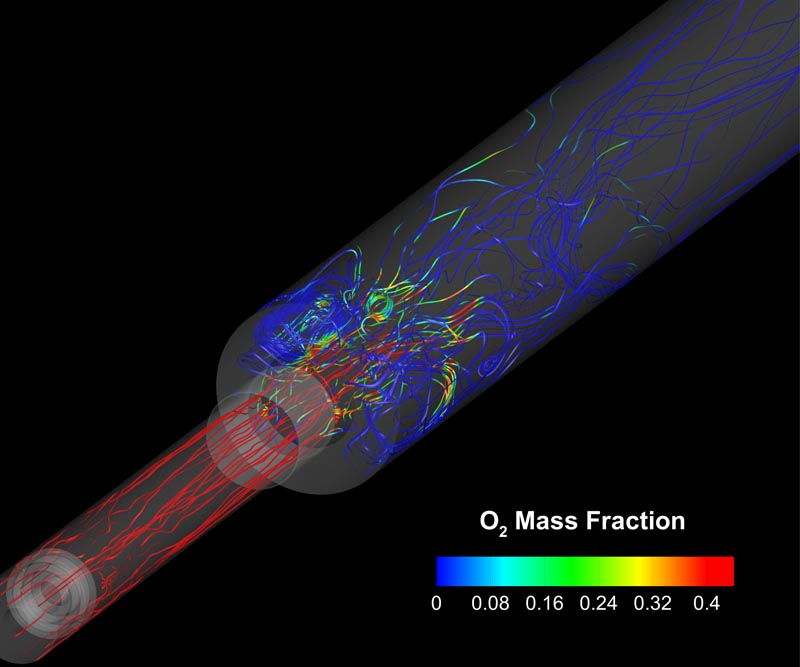
Navier-Stokes simulation of a V-22 Osprey rotor in hover, using AMR and Spalart-Allmaras/DES turbulence model. Cutting plane shows AMR grids colored by vorticity magnitude, where magenta is high, blue is low. Neal Chaderjian, NASA /Ames An oblique shock impinges on an incoming turbulent boundary layer. Contours of the velocity gradient tensor are colored by streamwise momentum (blue indicates presence of reversed flow). Contours of negative dilatation (gray) are overlaid. Mach number &#61 2.28, Reynolds number &#61 2300. Brandon Morgan, Stanford University Unsteady flowfield streamlines colored with the oxygen mass fraction. Streamlines show oxygen-rich fluid entering and oxygen-depleted flow leaving, indicating that combustion 
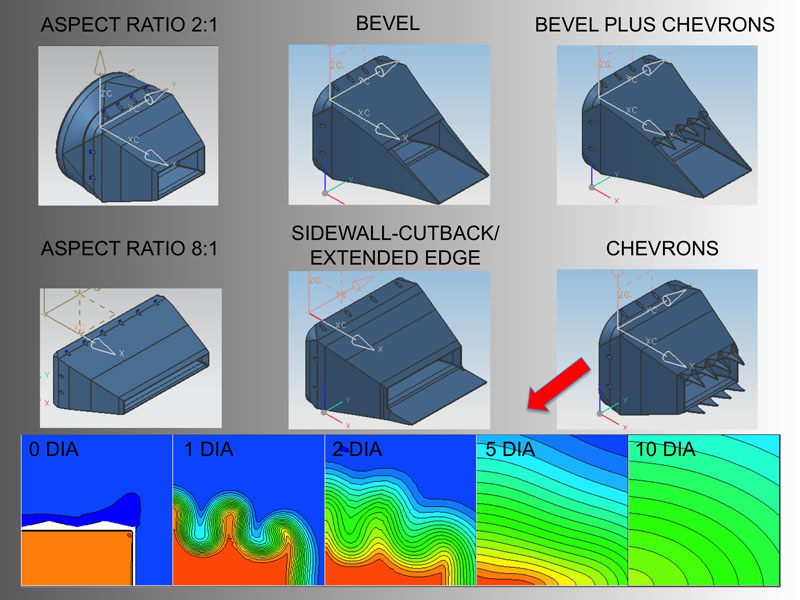
has taken place. Matthew Harvazinski, Purdue University Noise-suppression technologies integrated into the rectangular nozzle architecture. Velocity contour predictions at takeoff by the Wind-US structured solver. Results shown are for a chevron nozzle with a 2:1 aspect ratio.
Franco Frate, NASA/Glenn Navier-Stokes simulation of a V-22 Osprey rotor in hover, using adaptive mesh refinement (AMR) and a Spalart-Allmaras/detached eddy simulation (DES) turbulence model. Vortices are rendered with the q-criterion. Magenta indicates high vorticity, blue indicates low vorticity. Neal Chaderjian, NASA/Ames Isosurfaces of the Q-criterion colored by streamwise velocity illustrate the amplification of turbulence as vortex cores flow through an oblique shock/turbulent boundary layer interaction. Ivan Bermejo-Moreno, Brandon Morgan, Stanford University Methane fuel, shown by the pink surface, enters just before the expansion. As the fuel burns, the heat release surface and pressure grow until the fuel is depleted, and the cycle then repeats. Downstream from the combustion, the temperature is plotted on four slices. Matthew Harvazinski, Purdue University

Our Planet

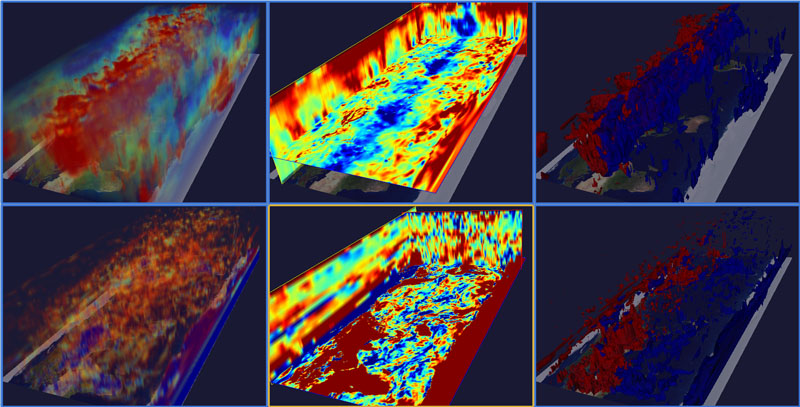
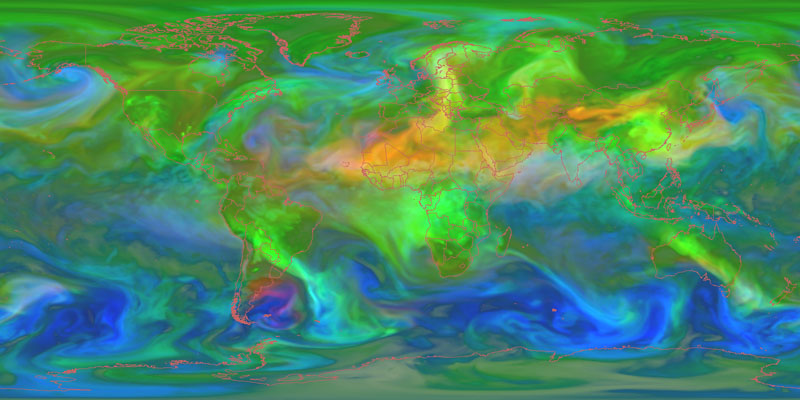
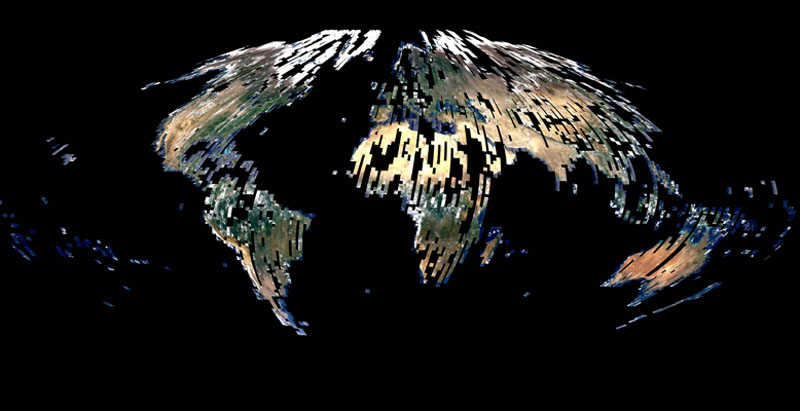
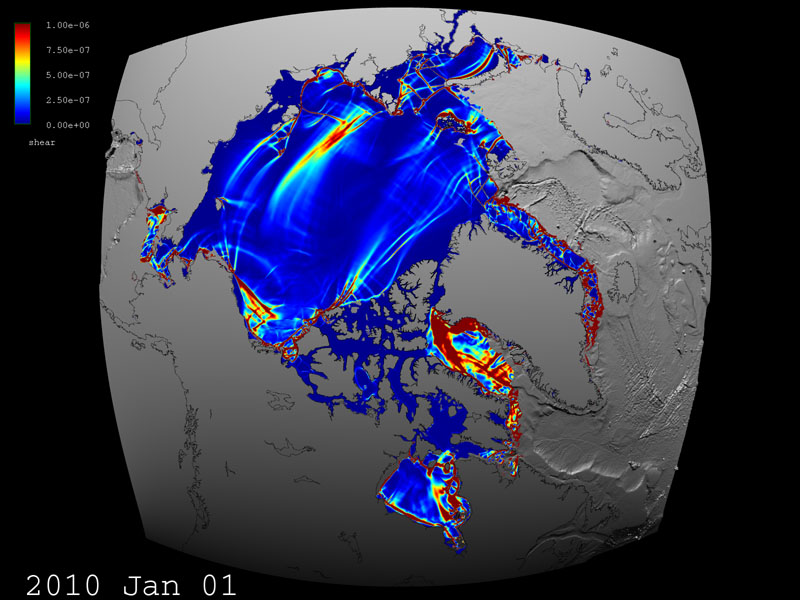
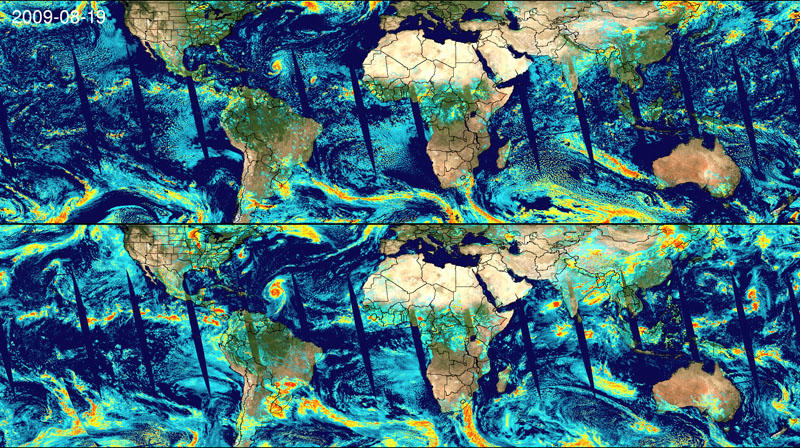
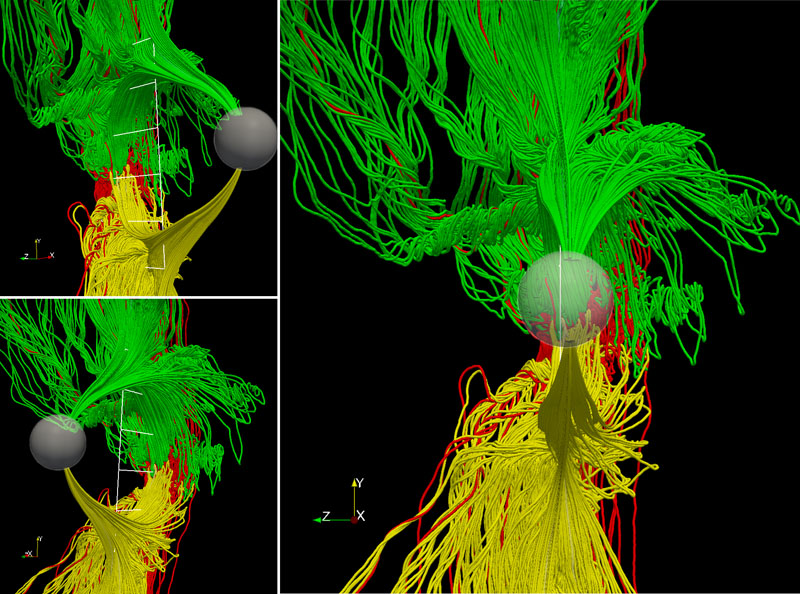
The UV-CDAT image spreadsheet showing NASA's multifaceted, interactive, 3D climate data exploration tools. The differences computed by the workflow in the top image are being explored. All cells feature multiple modes of user interaction. Thomas Maxwell, NASA/Goddard The Global Modeling and Assimilation Office is providing near-term decadal simulations for CMIP5 that include effects of aerosols, such as those depicted in this Goddard Earth Observing System 5 (GEOS-5) analysis of aerosol optical thickness, which indicates the degree to which aerosols prevent the transmission of light. Ellen Salmon, Eric Sokolowsky, NASA/Goddard Global, 30-meter resolution composite from May 2010 Landsat Enhanced Thematic Mapper Plus (ETM+) sensor data, developed through integration of Web-Enabled Landsat Data (WELD) products with NEX. The WELD products are developed specifically to provide consistent data that can be used to derive land cover, perform geophysical and biophysical assessment of regional surface dynamics, and study Earth system functions. Petr Votava, NASA/Ames; David Roy, South Dakota State University Hurricane Bill swirls over the Atlantic Ocean in this 3.5-kilometer global simulation using NASA's GEOS-5 atmosphere model. William Putman, NASA/Goddard Distribution of major groups of phytoplankton (see color bars) in an ecosystem ocean model. The model is driven by time-evolving ocean currents provided by the ECCO2 project. The model simulates 78 species of virtual phytoplankton, categorized into four broad functional groups. Distribution of chlorophyll is measured from space using satellite observations of ocean surface color. Oliver Jahn and the Darwin Project, Massachusetts Institute of Technology Sea-ice shear (s<sup>-1</sup>) on January 1, 2010 in a coupled ocean and sea-ice simulation carried out by the Estimating the Circulation and Climate of the Ocean, Phase II (ECCO2) project. The simulation has horizontal grid spacing of 4 kilometers, and is being used for comparisons with satellite retrievals from the RADARSAT Geophysical Processor System (RGPS). Gunnar Spreen, NASA/JPL; Tim Sandstrom, NASA/Ames GEOS-5 has completed a two-year "Nature Run" at 10-kilometer resolution–the highest resolution of its kind–to assess the value of new observations within the data assimilation system. Using satellite simulators, we can fly satellites through the model to provide a representation of observations such as cloud optical thickness (top) compared with the actual Moderate Resolution Imaging Spectroradiometer (MODIS) observation (bottom). William Putman, NASA/Goddard These images from a 3D global hybrid simulation of the Earth's magnetosphere show the formation of large-scale magnetic flux ropes. These flux ropes are a direct consequence of the reconnection process that enables the solar wind to penetrate into the magnetosphere. Homa Karimabadi, University of California, San Diego; Burlen Loring, University of California, Berkeley

Space Exploration

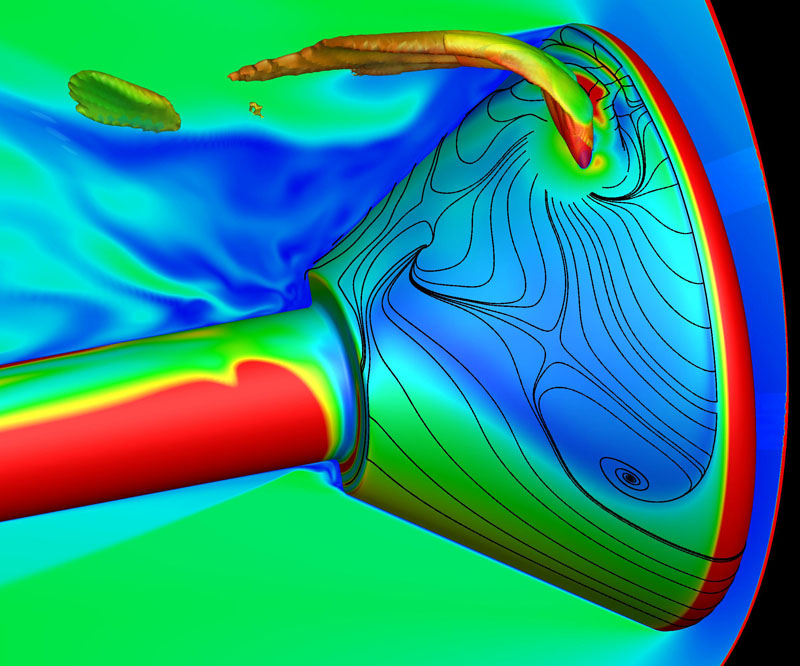
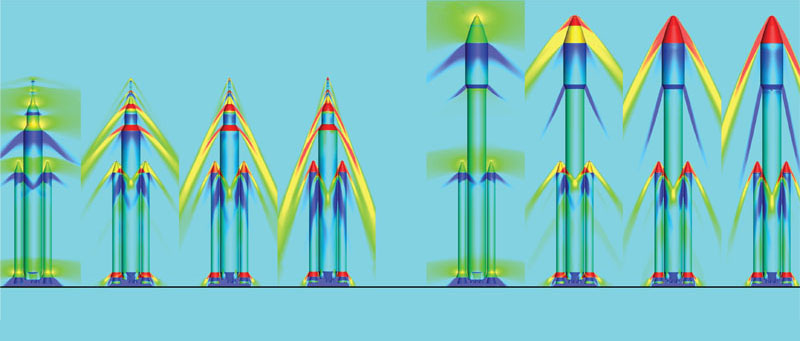
A Data Parallel Line Relaxation (DPLR) simulation of an experimental test, used to characterize the influence of the Orion vehicle's reaction control system on the aerothermal environments. The surface heat flux and Mach contours are illustrated along with the jet enthalpy. Chun Tang, NASA/Ames Temperature isosurfaces, which are colored by pressure, highlight the unsteady flow features around the Launch Abort Vehicle's attitude control motor and abort motor plumes. (Josh Rojahn, NASA/Marshall) Contour plots of pressures on the vehicle surface and on a cutting plane for two early candidate crew and cargo launch vehicle designs at four Mach numbers. Michael Barad, NASA/Ames Plumes from the Orion Launch Abort Vehicle's abort motors at Mach 2.5 and an altitude of 190,000 feet. High-resolution calculations predict the formation of Gortler vortices in the plume's shear layers. Robert Childs NASA/Ames Simulation of a potential Space Launch System (SLS) launch site configuration, showing surface pressure signatures with plume formation at an instant of time. A perspective view is shown above, and a side view is shown below. Michael Barad, Jeffrey Housman, NASA/Ames Contours of turbulence intensity and isosurfaces of mean vorticity from a simulation of flow past a wind tunnel model of the Orion crew module during reentry at Mach 0.5. Turbulence is minimal at the stagnation point on the heat shield and increases in the wake. Unsteady vortex wake can affect parachute deployment. Paul Stremel, Matthew McMullen, NASA/Ames Dynamic interaction of the attitude control motor plumes in proximity to the launch abort tower. Jan Carlson, NASA/Langley Pressure contours through the centerline of the Ares I Scale Model Acoustics Test simulation as the rocket ignites, the ignition overpressure propagates, and the plume stabilizes.

Supercomputing

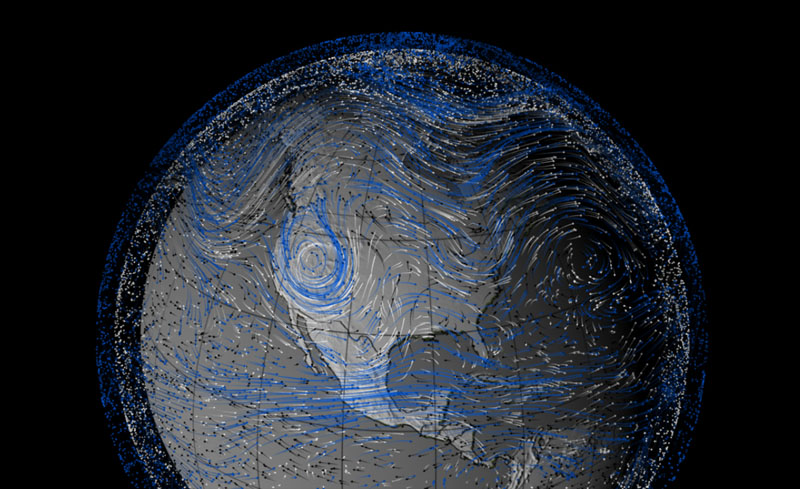
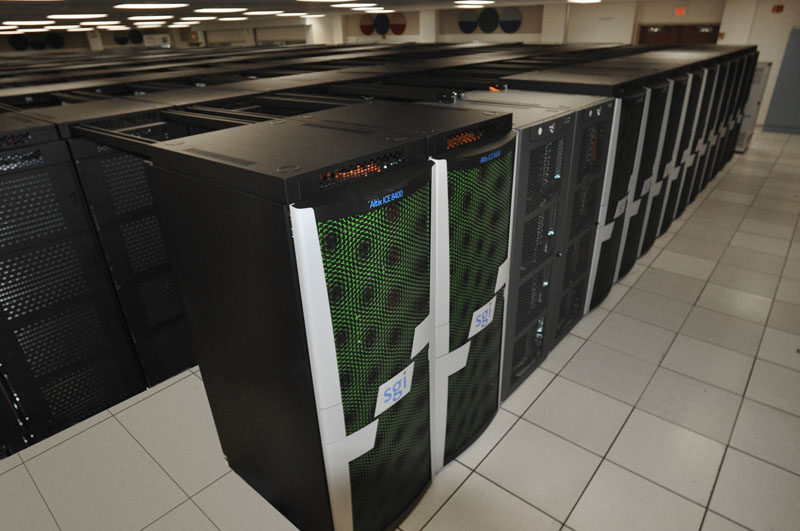
The Discover supercomputer at the NASA Center for Climate Simulation now includes 64 NVIDIA Tesla M2070 graphics processing units (GPUs) for specialized science data analysis. Jarrett Cohen, NASA/Goddard The Modern Era Retrospective-analysis for Research and Applications (MERRA) project is a comprehensive reanalysis of the last 30 years of weather/climate data. This visualization shows the combined U and V components of wind velocities at three different pressure levels: 850, 500, and 350 millibars. Trent L. Schindler, Greg Shirah, NASA/Goddard This artist's rendition depicts the current configuration of the Pleiades supercomputer, containing the following types of Intel Xeon processors: X5670 and X5675 (Westmere), X5570 (Nehalem), and E5472 (Harpertown). Marco Librero, NASA/Ames With the recent introduction of an SGI Rackable cluster with NVIDIA Tesla graphics processing units, Pleiades now offers enhanced capabilities to accelerate computational work for NASA's user community. William Thigpen, NASA/Ames

The Universe

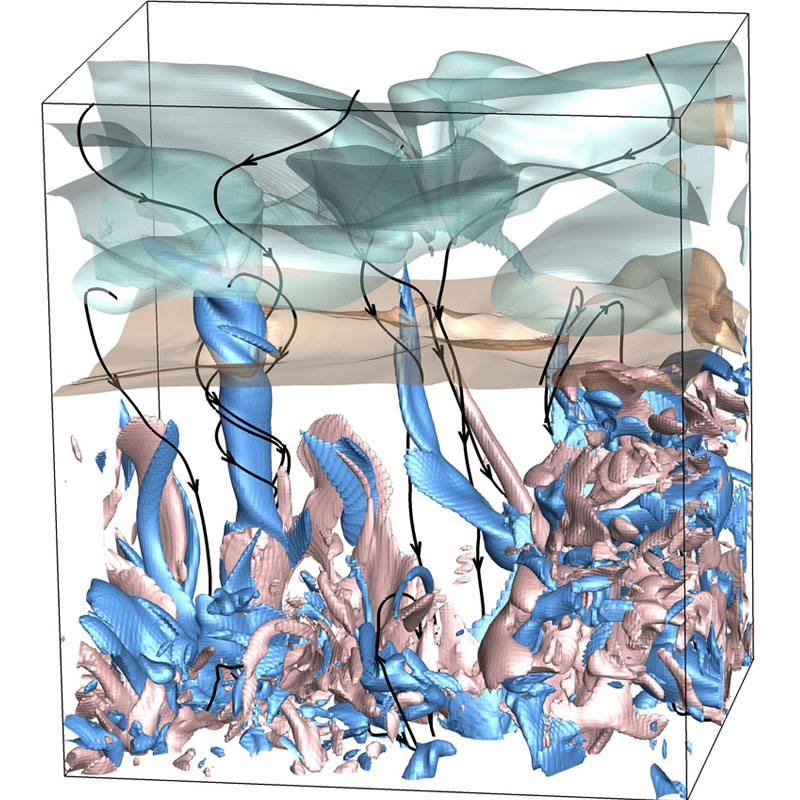
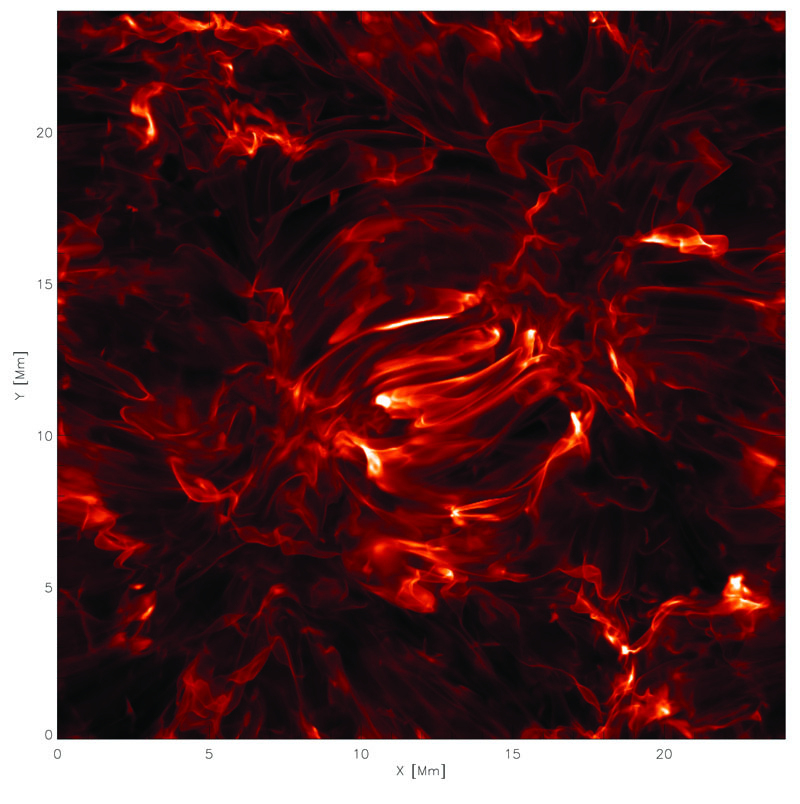
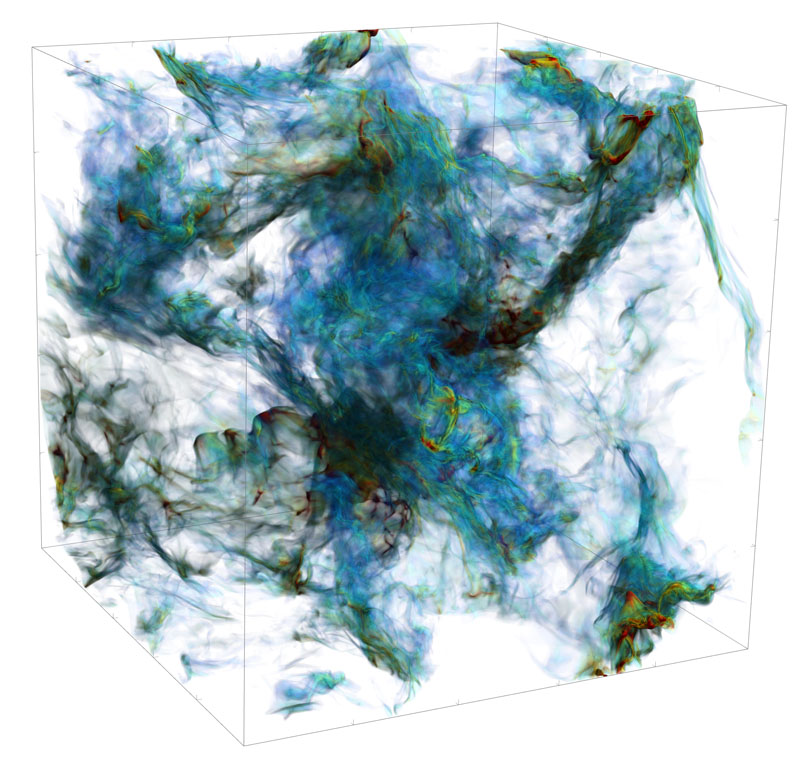
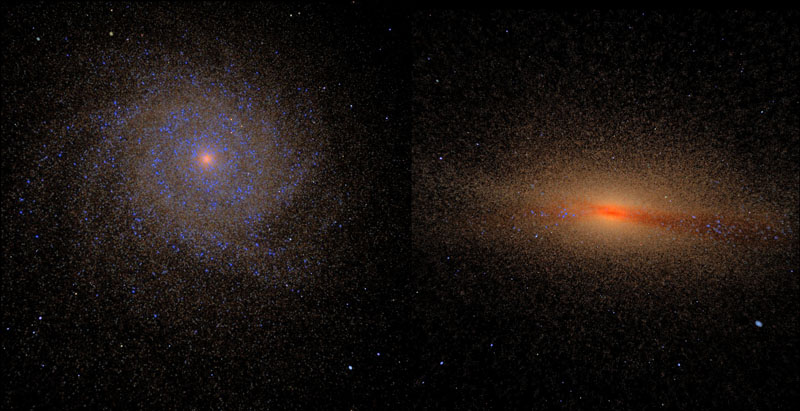
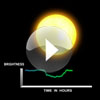
Vortex-tube structure extended below and above the solar surface. Volume rendering shows kinetic helicity (positive and negative). Semi-transparent, light-brown surface shows the visible surface of the Sun. The semi-transparent, light-blue surface shows the chromospheric level. Irina Kitiashvili, Stanford University; Alan Wray, NASA/Ames Image of the Sun as it will be viewed through a filter on-board NASA's Interface Region Imaging Spectrograph. The filter only shows light emitted by plasma that is at a temperature of about 20,000 Kelvin. The synthetic image is derived from numerical simulations that reveal how the Sun's magnetic field structures its atmosphere on fine scales. The region shown is twice as large as the Earth. Mats Carlsson, University of Oslo Volume rendering of the density field from an idealized experiment of magnetized hypersonic turbulence, without self-gravity. Dense filaments and cores are formed from turbulent shocks, even without the assistance of self-gravity. Tim Sandstrom, NASA/Ames Using the radiative-transfer code Sunrise enables the prediction of many observable properties of simulated galaxies. Patrik Jonsson, Harvard Smithsonian Center for Astrophysics; Joel Primack, University of California Santa Cruz Interaction of vortex tubes below the solar surface (~200 km) produce acoustic waves, which propagate at a speed of 7-14 km/s. In this movie, the grayscale background pattern shows density fluctuations, the red and blue contours show the vertical vorticity (positive and negative). Irina Kitiashvili, Stanford University; Alan Wray, NASA/Ames Magnetic field (visualized on a logarithmic scale) emerges as Ω-shaped loops with a filamentary structure. Most magnetic flux is pushed down by fast convective downdrafts, but some is pushed up by slow convective upflows or floats up due to buoyancy. Vertical flux concentrations form where loops pass through the top boundary of the computational domain. One such flux concentration, shown in the upper left corner, has formed a rotating pore. Robert Stein, Michigan State University; Tim Sandstrom, NASA/Ames Video of the Sun as it will be viewed through a filter on-board NASA's Interface Region Imaging Spectrograph. The filter only shows light emitted by plasma that is at a temperature of about 20,000 Kelvin. The synthetic image is derived from numerical simulations that reveal how the Sun's magnetic field structures its atmosphere on fine scales. The region shown is twice as large as the Earth. Mats Carlsson, University of Oslo The results from NASA's Kepler Mission will come from measuring the brightness of observed stars. The data will look like an EKG showing the activity of the heart over time. When a planet passes in front of its parent star, as viewed from our solar system, it produces a tiny pulse or beat. From the repeated beats we can detect and confirm the existence of Earth-size planets and learn about the orbit and size of the planet. The scientific results from Kepler come in a different way than most astronomy missions. They do not produce pretty pictures or even colorful spectrograms, but rather light curves that take several years to gather. NASA/Ames; Dana Berry, SkyWorks Digital, Inc.
http://nas.nasa.gov/SC11/gallery.html