
Visualizations of Typhoon Morakot Help Scientists Improve Weather Simulation
Scientists are exploring detailed views of a devastating typhoon using concurrent visualization technology developed in the NAS Division.
With concurrent visualization techniques, scientists can analyze and interpret data from supercomputing calculations as they are running. NAS visualization experts recently completed a simulation of the 2009 Typhoon Morakot for the 96-hour period surrounding its passing over Taiwan, during which rainfall exceeded 2 meters.
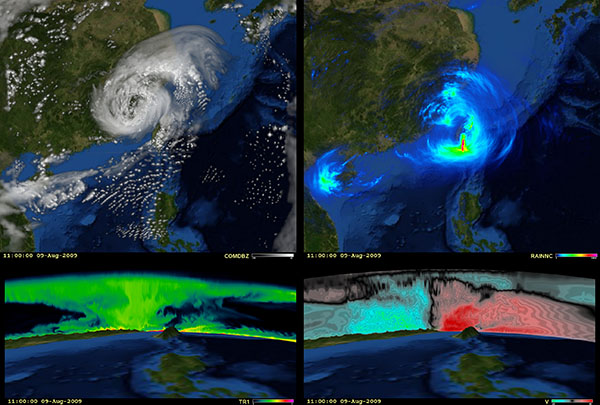
The visualization work was done for atmospheric scientists at NASA Goddard's Mesoscale Dynamics and Modeling Group approximately 6.5 days to generate using the Weather Research and Forecasting (WRF) Model 3.1 software on 224 processors of the Columbia supercomputer located at the NAS facility.
Concurrent visualizations were generated using the hyperwall-2 system, and the resulting output gave Goddard researchers many detailed views to carefully study simulation performance for an important weather event.
Simulation states were saved every 36 seconds, much more frequently than could be efficiently saved using netCDF, a software library and file format typically used for saving scientific data. In addition, generating the same visualizations using traditional post-processing methods would have extended the simulation run so much it would not be practical to get the same level of detail.
Statistics on the typhoon simulation include:
- Used 27 fields and 37 visualization configurations, one top-down for 2-D fields, a vertical sum and vertical slice for 3-D fields
- Showed 2 views per configuration for a total of 74 sets of frames 710,474 frames total
- Extracted 21 terabytes of field data
- Created 222 animations - three animation speeds for each of the 74 frame sets
