
Ocean-Atmosphere Mashup: A Recipe for Climate Predictions
to ~0.5 m/s (blue) to more than 2.5 m/s (white). The animation shows many concurrent processes, including large-scale and mesoscale eddies, tides, and the surface signature of internal waves. Nina McCurdy, David Ellsworth, NASA/Ames
What happens when scientists cook up a new recipe for understanding the workings of our planet? That’s what two teams studying Earth’s oceans and atmosphere decided to find out—with help from visualization experts in the NASA Advanced Supercomputing (NAS) Division and the agency’s high-performance computing (HPC) resources.
Rewind to 2014, when researchers at NASA’s Jet Propulsion Lab (JPL)/Caltech and Massachusetts Institute of Technology produced the most realistic global ocean simulation allowed by HPC resources at the time. This groundbreaking simulation, carried out by the Estimating the Circulation and Climate of the Ocean (ECCO) project, had horizontal grid spacing ranging from 750 meters (m) in the polar regions to 2.3 kilometers (km) at the equator; and allowed for the generation of internal waves, eddies, and other complex circulation features.
At the same time, their colleagues at the Global Modeling and Assimilation Office (GMAO) at NASA’s Goddard Space Flight Center were creating realistic atmospheric simulations with the Goddard Earth Observing System (GEOS). The highest-resolution GEOS atmospheric model has horizontal grid spacing of 1.5 km, allowing unprecedented realism in the representation of clouds in a global simulation.
Fast forward to early 2021. “We asked ourselves what would happen if we put these two systems together,” said Dimitris Menemenlis, a research scientist at NASA JPL. Menemenlis, along with ECCO cohort and MIT research engineer Christopher Hill, began working with colleagues Andrea Molod and William Putman at NASA Goddard to couple these two simulations and let them work together to create a new tool for weather and climate studies.
Recipe for Success
In order to gain a better understanding of these air-sea exchange processes, the two teams successfully carried out a first-of-its-kind, global coupled ocean-atmosphere simulation with kilometer-scale horizontal grid spacing. The timeframe of the simulation spanned fourteen months, starting with prescribed initial conditions dating from January 2020—a 12-month seasonal cycle with two additional months thrown in for the two simulations to “get to know each other,” according to Menemenlis.
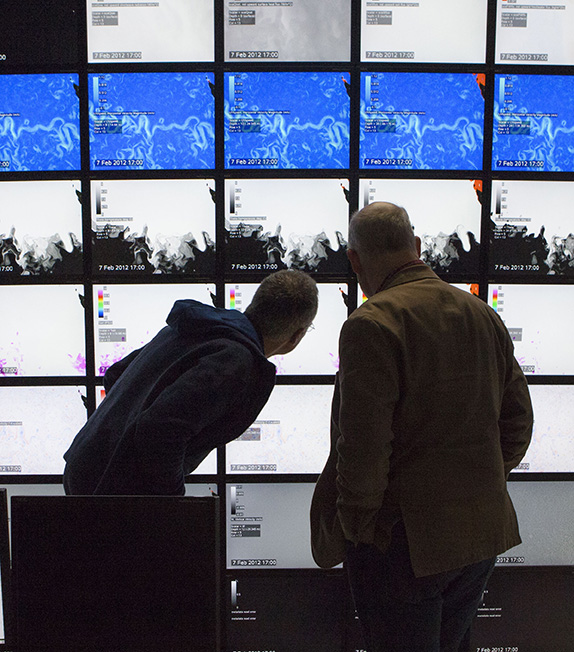
The resulting fully interactive ocean-atmosphere simulation—brought to life by the NAS Division’s Visualization and Data Analysis team—gives a much more realistic view of air-sea interactions than what was previously available in the separate models. These highly realistic simulations show that the atmosphere is affected by very fine-scale structures in the ocean, and, in turn, the ocean reacts to fine-scale and high-frequency atmospheric structures.
“Our eyes are so well trained to recognize patterns and spot inconsistencies. This makes visualization a powerful tool for exploring large simulation output, like that from the coupled ocean-atmosphere model—as well as for quickly validating that the simulation is running correctly, and sometimes even helping to fine-tune simulation parameters,” said Nina McCurdy, a visualization researcher in the NAS Division.
The simulation required almost a year of computer time on about 9,000 cores of the Pleiades and Aitken supercomputers at the NAS facility, and produced nearly two petabytes of model output.
“This simulation and its analysis would not be possible without NASA’s high-performance computing resources, including data storage, and tremendous help and support from the NAS visualization team,” said Menemenlis.
New Discoveries of Earth’s Complexity
The coupled model is helping researchers understand how ocean eddies, which act as a major pathway for transferring heat from the ocean to the atmosphere, affect both air and sea circulation. For example, one early study, based on the coupled model simulation output in the Gulf Stream region, focused on recurring, intermittent wind events. The structure of these wind events depends on small-scale sea surface temperature (SST) fronts that border SST anomalies. These intermittent events can only be resolved when both the atmospheric and oceanic components of the coupled simulation have horizontal grid spacing of 10 km or less, as is the case in this coupled simulation.
While initial results of the ocean-atmosphere simulation provide a unique view of how climate and weather work together, the scientists want the coupled model to reflect what’s happening in the real world as much as possible. Recently, they went on a field campaign off the coast of Monterey in California to help gather data, including measurements of ocean winds and the speed of surface currents, taken from airplanes using Doppler scatterometer technology and another airborne instrument that measures surface temperature. They found that the observed features—which were not present in the previous, ocean-only simulations—are very similar to those in the new simulation.
Another early study focused on the transfer of kinetic energy between the ocean and the atmosphere. The complex interplay of surface wind stresses and currents revealed by the numerical simulation motivates the need for a winds-and-currents satellite mission to directly observe wind work.
Understanding Earth’s Complexity and Beauty
“We’re excited that we’re already gaining new insight from the preliminary coupled simulation,” said Menemenlis. Output from the coupled model is being made available to the scientific community, providing a unique dataset for atmospheric and oceanic studies as well as for satellite and in-situ observing system design.
“We’re even more excited about what we will be able to learn from an upcoming higher-resolution coupled model, which will contain four times more horizontal grid cells in both the ocean and atmosphere, enabling an even more realistic representation of weather and climate processes.”
Insights gained from the coupled ocean-atmosphere simulations will not only help explain how these ocean-atmospheric processes function, but it will also increase understanding of Earth’s changing climate and weather—and, says Menemenlis, the “complexity and beauty of how these things work together.”
—Jill Dunbar, NASA/Ames Research Center
