
Mapping the Semi-Arid Land Carbon Sink: A Tree Census From Polar-Orbit
Overview
Some areas of the Earth are reacting to climate change much more quickly than others, and researchers are using these “canaries in the gold mine” as early indicators of climate change’s full effects. The world’s arid and semi-arid regions are particularly prone to rapid changes in climate, which can alter vegetation growth and affect livelihoods. Moreover, vegetation acts as a natural “carbon sink,” a reservoir that absorbs and stores the atmosphere’s carbon—carbon that could be released as carbon dioxide back into the atmosphere in the event of disturbances and lead to further climate forcing.
Focusing on one such region, NASA and University of Minnesota researchers are determining the carbon content of discrete trees in the arid and semi-arid zones south of the Sahara Desert in Africa. They are mapping individual tree-crown area and determining tree heights using 50-centimeter (cm) satellite data over 10 million square kilometers via high-performance computing (HPC) and massively parallel data processing.
Project Details
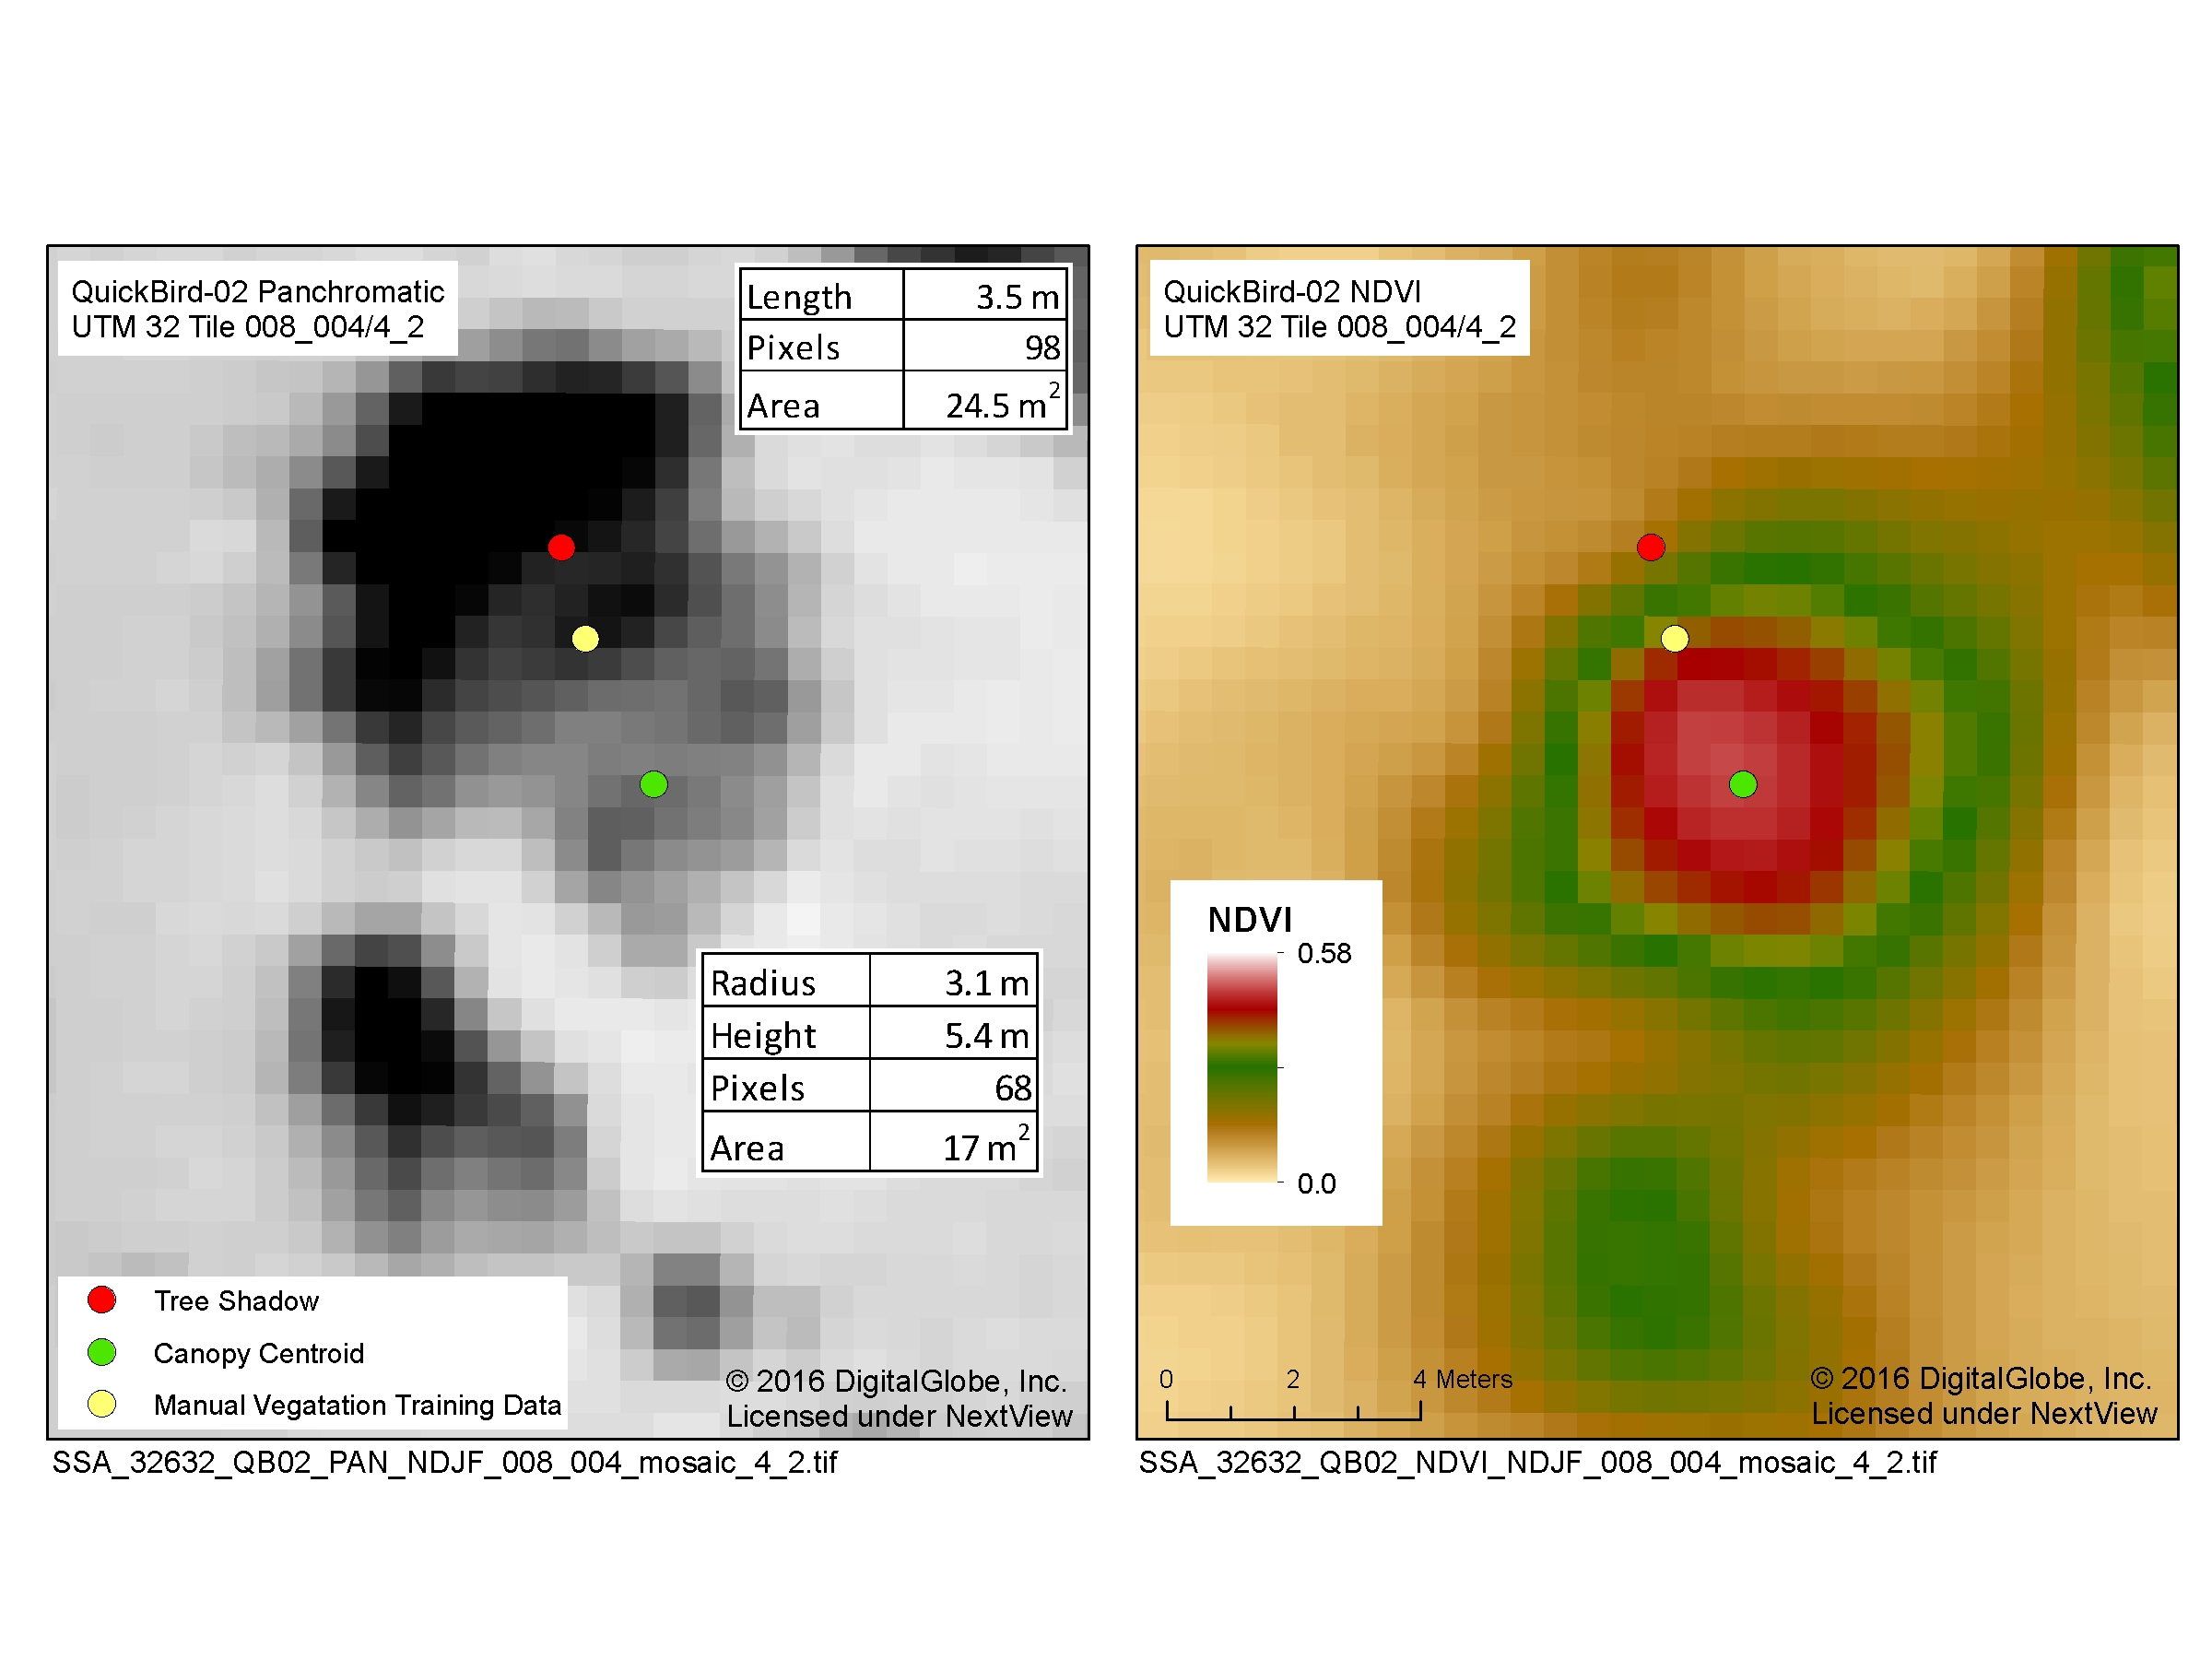
For vast regions like the sub-Saharan area, researchers have limited ground survey data for understanding how climate affects vegetation. In conjunction with small sets of field data, the team is analyzing massive quantities of high-resolution satellite imagery of the sub-Saharan area from commercial satellite data provider DigitalGlobe. NASA obtains these data for research purposes through an agreement with the National Geospatial Intelligence Agency.
Processing and analyzing 50-cm data over an area bigger than the continental U.S. presents a daunting challenge. With no single computing system optimized for the task, the researchers are leveraging an innovative combination of HPC systems including an on-premise cloud designed for large-scale data analysis and public cloud resources.
Results and Impact
In a continuing multi-year effort, satellite data processing has assembled panchromatic and multi-spectral mosaics of much of sub-Saharan Africa. Atmospheric-correction techniques, first applied to Moderate Resolution Imaging Spectroradiometer data from NASA’s Terra and Aqua satellites, are used to sharpen the DigitalGlobe images and minimize atmospheric variations in the satellite data.
From the assembled image mosaics, the team measures the area of individual tree crowns and their heights to estimate the total carbon stored in Sub-Saharan woody vegetation for the first time. By re-analyzing the same areas with satellite data from later years, researchers can also track carbon changes over time. This work is fundamental to determining where the land carbon sink is and what modulates the important arid and semi-arid land carbon sink. Although the arid and semi-arid land carbon density is low, its area comprises about 30 percent of the global land surface.
Why HPC Matters
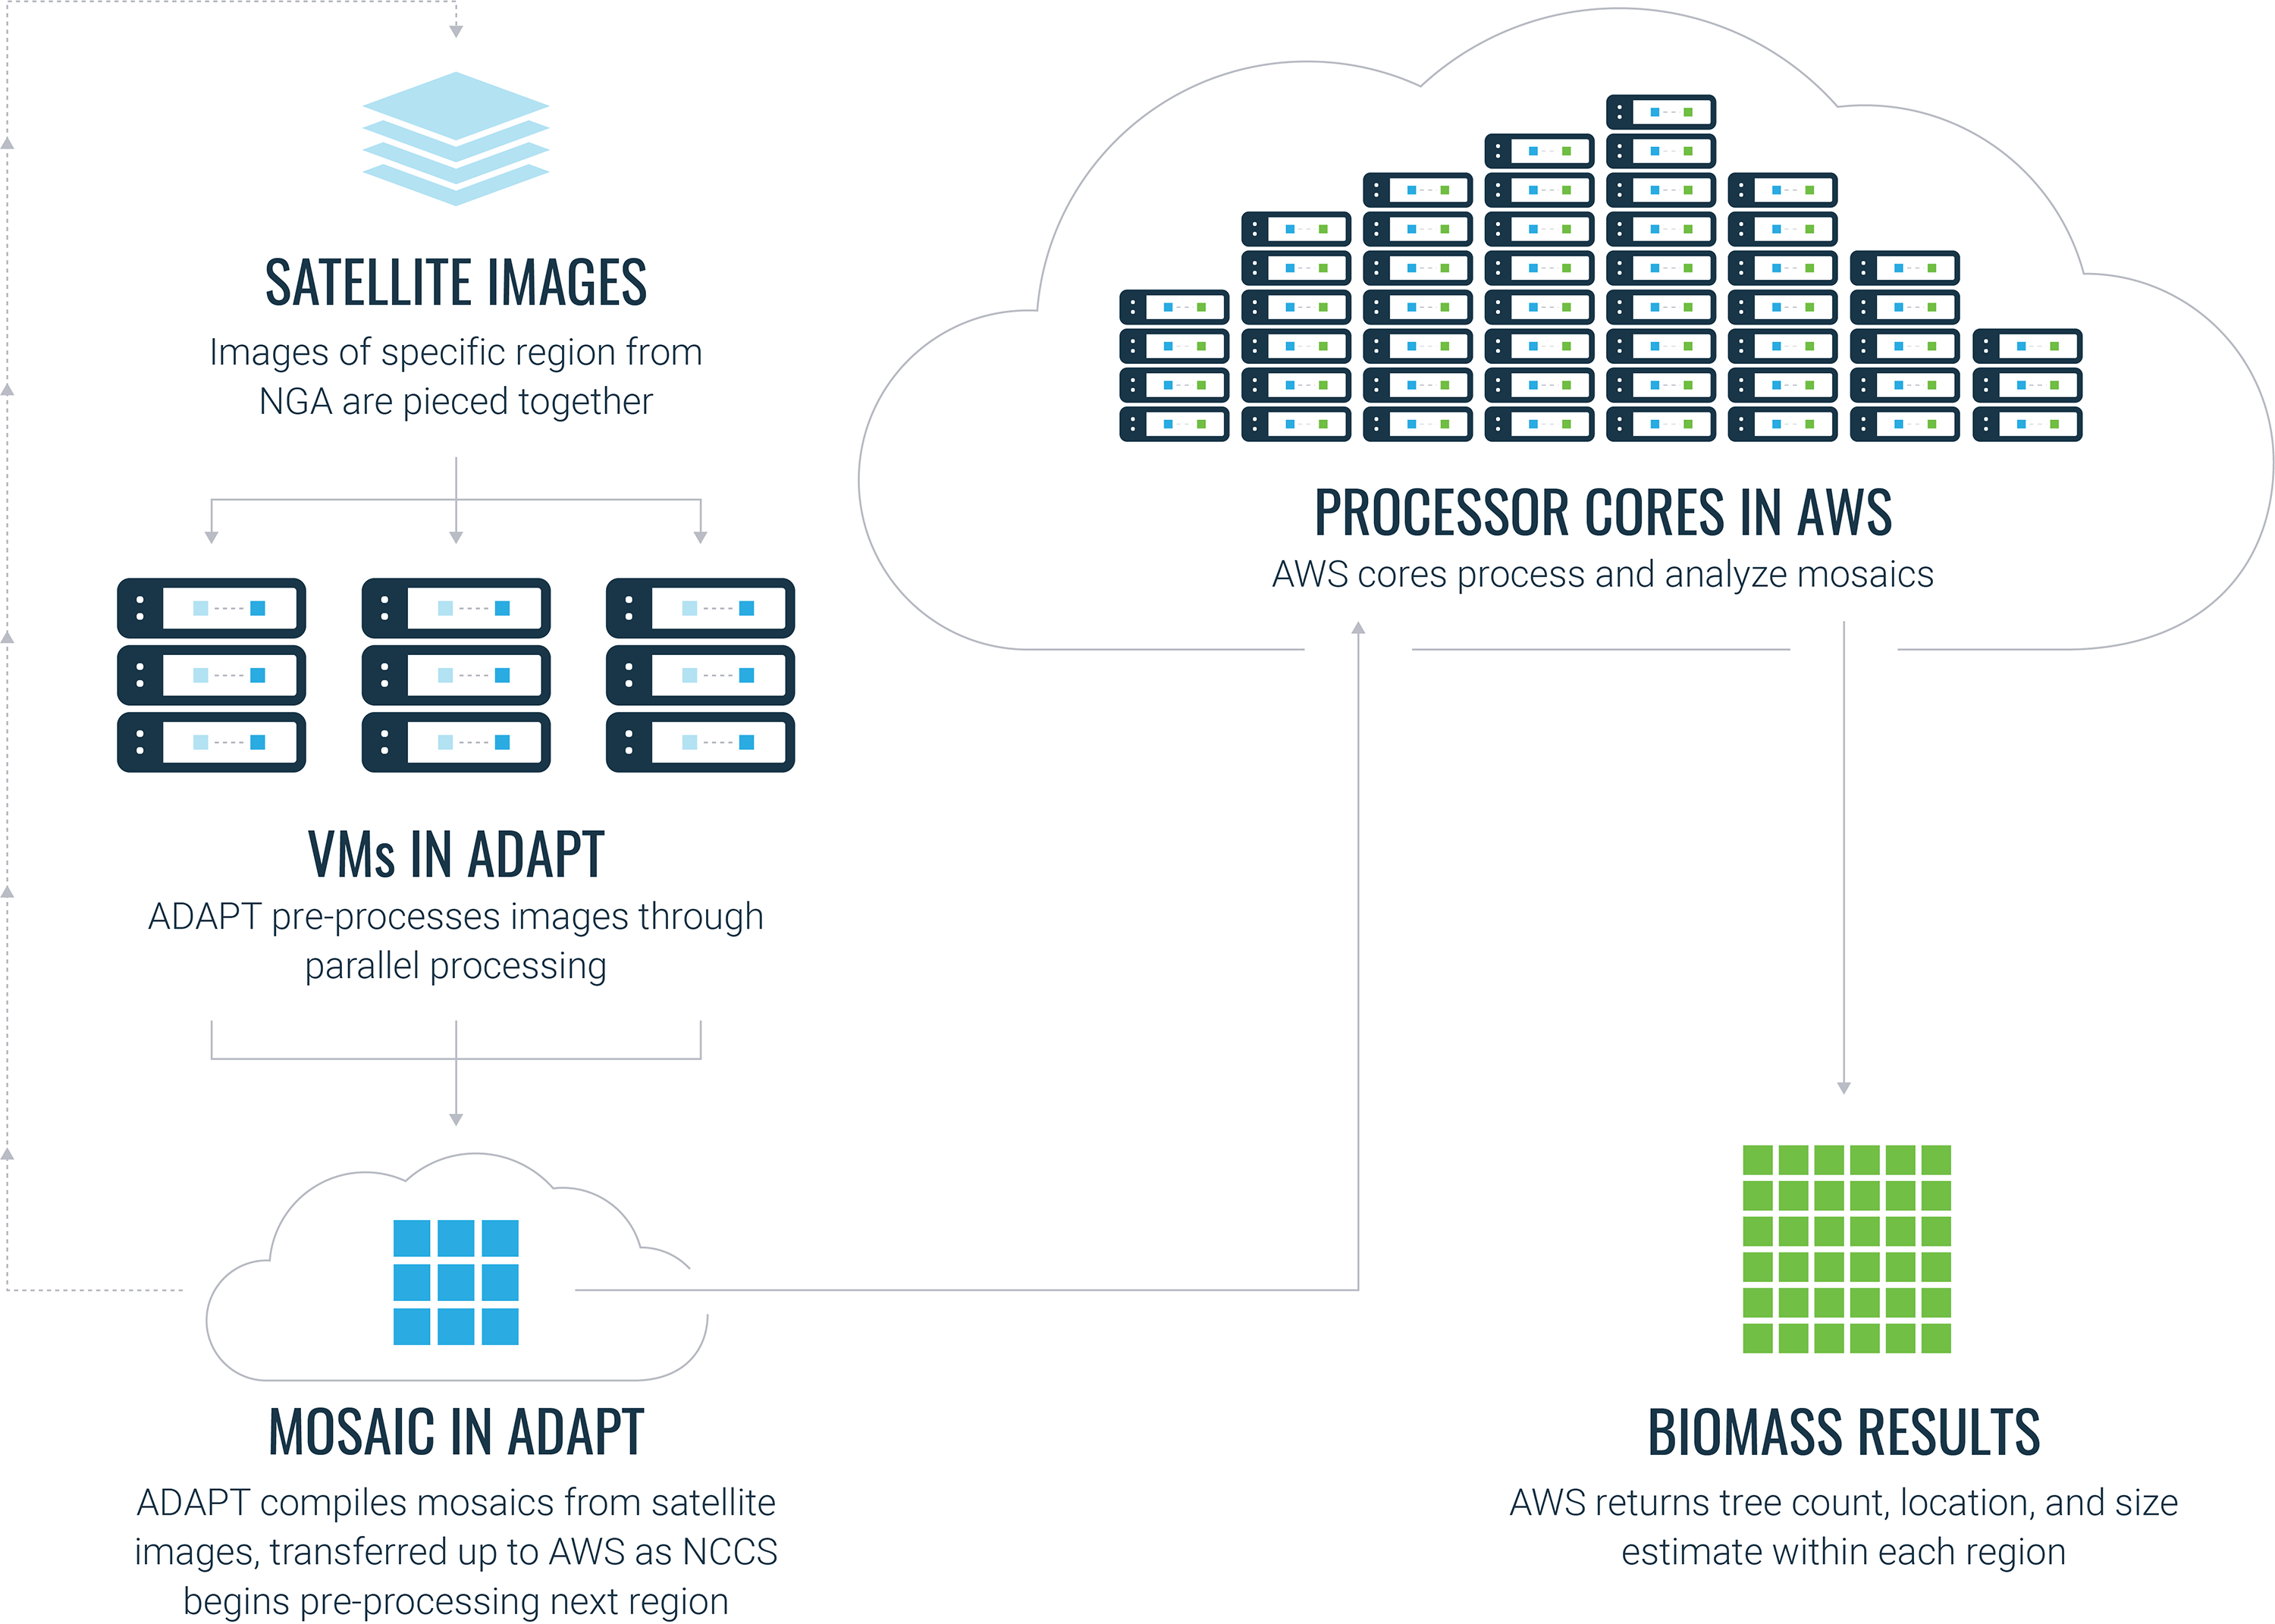
As of September 2018, this project has processed ~800,000 satellite images totaling 600 terabytes of data. Analysis at such a massive scale requires substantial HPC resources, and this project leverages an innovative combination of the NASA Center for Climate Simulation’s Advanced Data Analytics Platform (ADAPT), Amazon Web Services, and high-speed, wide-area networks.
What's Next
Researchers have begun using the Sub-Saharan area mosaics to create digital elevation images with x-y resolutions as fine as 50 cm, which enables extending the analysis to densely forested areas such as the Amazon and Congo rainforests. Combining the digital elevation image technique with the algorithms to segment individual tree canopies, researchers can apply these techniques worldwide to create high-resolution maps of carbon contained within forests.
More Information
- See the poster for this demonstration (PDF, 1.8MB). As shown in the NASA booth at SC18.
compton.j.tucker@nasa.gov