Monitoring COVID-19-Related Changes in Carbon Dioxide from Space
Overview
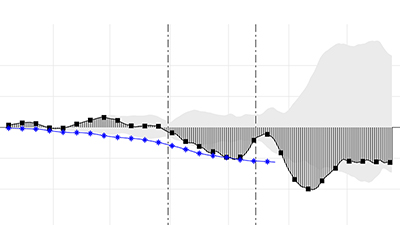
As the COVID-19 pandemic altered human activity across the planet in 2020, NASA satellites provided unique global views that allowed scientists to track changes in air pollution, energy usage, and greenhouse gas emissions as they happened. Here, we report some of the first evidence of global changes in carbon dioxide (CO2) concentrations during COVID-19. We used an analysis that combines observations from one of those NASA satellites—the Orbiting Carbon Observatory-2 (OCO-2)—with NASA’s Global Earth Observing System (GEOS) modeling system.
"Our analysis shows that, from February through May 2020, atmospheric CO2 concentrations increased at a slower rate compared to what would be expected during a non-pandemic year. The calculated drop of 0.24–0.48 parts per million (ppm) corresponds to reductions of 5–10% in global anthropogenic emissions. Observing and analyzing changes nearly 1,000 times smaller than the global 400 ppm background concentration of CO2 is a significant achievement for present-day satellite sensors and modeling systems."
Project Details
OCO-2 provides high-quality observations of CO2 concentrations from Earth’s surface to the top of the atmosphere during cloud-free, sunlit conditions. Merging GEOS model fields with OCO-2 data, using a mathematical technique called data assimilation, produces daily gap-filled maps of CO2 concentrations. We estimate changes in 2020 by comparing maps from 2020 with an average from previous years that represents typical conditions.
Results and Impact
Our analysis shows that, from February through May 2020, atmospheric CO2 concentrations increased at a slower rate compared to what would be expected during a non-pandemic year. The calculated drop of 0.24–0.48 parts per million (ppm) corresponds to reductions of 5–10% in global anthropogenic emissions. Observing and analyzing changes nearly 1,000 times smaller than the global 400 ppm background concentration of CO2 is a significant achievement for present-day satellite sensors and modeling systems. The results also powerfully demonstrate the capability to effectively monitor greenhouse gas concentrations from space, a longstanding goal of NASA and international space agencies.
Why HPC Matters
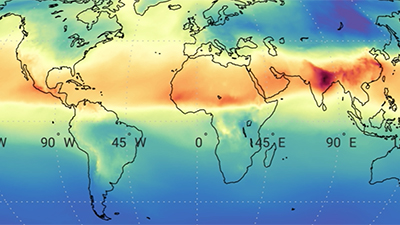
The NASA Center for Climate Simulation (NCCS) played a critical role in this work by providing the high-performance computing (HPC) resources needed to quickly create a multi-year record of gap-filled CO2 products. Typically, analyzing multiple years of data requires far more resources than are available on a personal computer and can take several months to complete even on an HPC platform like NCCS. For this study, using the NCCS Discover supercomputer, we split the analysis period into six shorter streams running in parallel on 500 computing cores each. Taking that approach, along with the NCCS prioritizing COVID-19 impact studies, enabled completing the simulations in just a few days.
What's Next
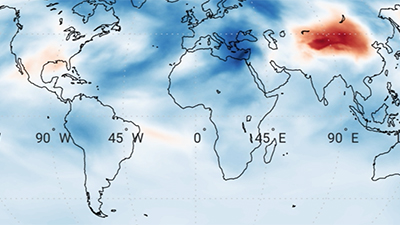
Global CO2 results are now efficiently updated monthly in support of national and international “dashboard” efforts aimed at tracking COVID-19 impacts from space. Scientists will continue to closely monitor changes in CO2 emissions over the coming months. It remains to be seen whether CO2 concentrations will continue to increase, consistent with a global economic rebound, or whether a rise in COVID-19 cases during the current flu season could result in further decreases in emissions.
Related Links
- NASA Earthdata COVID-19 Dashboard
- Assimilating Satellite Data Yields a First Look at COVID-19’s Impact on Carbon Dioxide
brad.weir@nasa.gov Lesley Ott, NASA Goddard Space Flight Center
lesley.ott@nasa.gov