Gene Hub Analysis to Identify Host Response
to COVID-19
Overview
SARS-CoV-2, the virus responsible for causing the COVID‑19 pandemic, has an RNA-based genome. To determine expression levels of the virus’s genes and the host response, we have analyzed nasal swabs from polymerase chain reaction (PCR)-tested patients using RNA-sequencing, a more sensitive technology. Weighted gene co-expression network analysis (WGCNA) was then used to identify common co-expressed gene patterns that are related to SARS‑CoV‑2 viral load. Results revealed a strong immune system response following SARS‑CoV‑2 infection.
"Analysis of gene expression data in patients with COVID-19 identifies biological responses due to the virus, which may be targeted for drug therapy. Furthermore, some patients that tested negative for SARS‑CoV‑2 virus using the common PCR-based test, showed some virus genomic material in their samples using more sensitive sequencing technologies, which should be further investigated."
Project Details
RNA sequencing (RNAseq) data from 845 samples, including nasal swab tests, environmental swabs, and positive and negative control samples, were obtained from Chris Mason, Cornell University. Data processing pipelines were established and optimized to enable the rapid alignment and analysis of the sequencing data using NASA high-performance computing (HPC) resources and services. The RNAseq data from each sample were classified as human, SARS‑CoV‑2, or microbial (including non-SARS‑CoV‑2 viruses) using the publicly available software, Kraken2, which determines the origin of sequence data based on sequence complexity.
The human-classified sequence data were mapped to the human genome to identify and quantify the genes expressed in each sample. The gene expression data were then filtered to reduce noise and all nasal swab samples were evaluated for expression of SARS‑CoV‑2 based on RNAseq data and compared with SARS‑CoV‑2 expression based on the PCR test commonly used to diagnose COVID‑19. Note that for the PCR test, the amount of SARS‑CoV‑2 virus present in each sample is inversely proportional to the Ct value (a measure of expression), such that the lower the Ct value, the more virus particles are present. If the Ct value of a sample is 40 or more, the patient from which that sample was derived is considered negative for COVID‑19. For RNAseq analysis, the higher the counts value (another measure of expression), the more virus particles are present, and samples containing 100 or less SARS‑CoV‑2 counts were considered negative for COVID‑19.
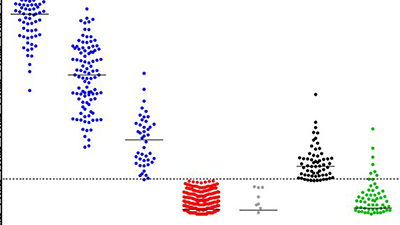
Next, the samples were grouped based on PCR test status, RNAseq gene expression data, and whether or not the samples contained viruses other than SARS‑CoV‑2. To evaluate how COVID‑19 (alone) effects gene expression, samples containing viruses other than SARS‑CoV‑2 were removed to reduce confounding effects. RNAseq quantified gene expression (count) data from the remaining samples were normalized to account for any differences due to technical variation, then underwent voom (mean variance modelling) transformation using the LIMMA (Linear Models for Microarray Data) software package to stabilize the variance. The normalized count data, from samples that were either positive or negative for SARS‑CoV‑2 based on both the PCR test and the RNAseq count value cutoff, were used for WGCNA. The WGCNA results were used to identify co-expressed gene patterns relative to viral load (that is, which gene pathways are turned on or turned off in patients with COVID‑19 compared to patients without COVID‑19). The quantified expression of SARS‑CoV‑2 RNAseq data was also used to assess the accuracy and sensitivity of the PCR-based nasal swab test.
Results and Impact
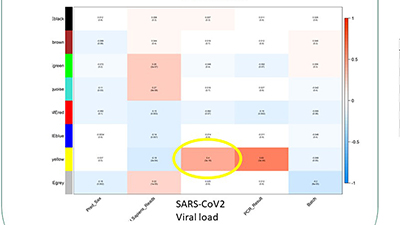
Analysis of SARS-CoV-2 RNAseq expression showed that some samples that were negative for COVID‑19 based on the nasal swab PCR test actually contained viral genomic matter. WGCNA analysis identified correlated genes/gene hubs based on gene expression data. Correlation of viral load (SARS‑CoV‑2 counts) to the identified gene co-expression networks (hubs) revealed one hub that was significantly correlated with viral load. Gene ontology analysis (topGO) of the genes that formed this hub revealed a series of related biological pathways involving the innate immune system that are enriched in patients infected with SARS‑CoV‑2. These genes were shown to be sufficient to group patients with SARS‑CoV‑2 vs. patients negative for SARS‑CoV‑2 using principal component analysis (PCA). PCA shows that patients with other respiratory viral infections also have similar innate immune responses to patients infected with SARS‑CoV‑2.
Interestingly, we did not see a strong response overall in the samples that were negative based on the PCR test, but positive based on RNAseq analysis. These data suggest a common gene response to known viral infections and SARS‑CoV‑2, but that some patients who tested negative for SARS‑CoV‑2 using the PCR-based test may actually have a lower grade of infection and immune response to this pathogen as revealed by comprehensive RNAseq analysis approaches.
Why HPC Matters
NASA HPC resources and services played a critical in role in generating the project data. The COVID‑19 International Research Team (COV‑IRT) utilized these resources to develop and test three data processing pipelines. HPC experts in the NASA Advanced Supercomputing Division were instrumental in helping troubleshoot, debug, and optimize the PBS scripts within each pipeline, allowing for parallel processing of samples and thus reducing processing time. To date, a total of 845 samples (732 patient nasal swabs, 62 environmental swabs, and 51 control samples) have been processed through each pipeline on the Pleiades supercomputer, generating approximately 107 terabytes of data. The project used on average four Intel Xeon Haswell nodes for about 19,300 hours, for a total of 77,200 node-hours.
What's Next
Future experiments will investigate the samples of groups who tested negative based on the PCR test, but positive based on RNA sequence analysis, for additional immune system activation, symptom severity, and outcome. The SARS‑CoV‑2 genomic data in these samples will also be further investigated to get more information on the coverage of the viral genome. Additional COVID‑19 samples will be tested for the immune activation profile identified in this study.
Robert Meller, Morehouse School of Medicinermeller@msm.edu Deanne Taylor. Children’s Hospital of Philadelphia
taylordm@email.chop.edu Christopher E. Mason, Weill Cornell Medical College
chm2042@med.cornell.edu Amanda Saravia-Butler, NASA Ames Research Center
amanda.m.saravia-butler@nasa.gov Afshin Behesti, NASA Ames Research Center
afshin.beheshti@nasa.gov Jonathon Schisler, University of North Carolina
schisler@unc.edu