A Global, Coupled Ocean-Atmosphere Simulation with Kilometer-Scale Resolution
Overview

Mesoscale sea surface temperature anomalies are known to influence atmospheric circulation. For example, ocean eddies in the Kuroshio Extension—part of a warm current system in the Pacific ocean near the coast of Japan—can remotely affect rainfall over the west coast of North America by energizing atmospheric storms. To better understand these air-sea exchange processes, and in support of climate observing system design, we have carried out a global, atmosphere-ocean simulation with kilometer (km)-scale horizontal grid spacing. This simulation will provide a deeper understanding of the nature of air-sea interaction and its influences on atmospheric storm tracks, ocean eddies, equatorial currents, and their feedback on the global atmospheric circulation. It will also provide insights into the design and observational requirements for future satellite missions, such as the proposed Winds and Currents Mission (WaCM), which is being designed to collect data on ocean winds and currents, simultaneously, through satellite observation.
Project Details
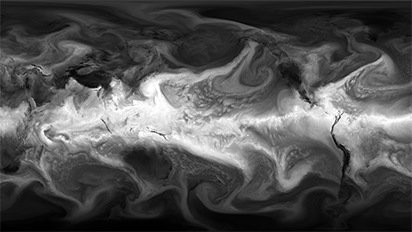
Our simulation comprises a C1440 configuration of the Goddard Earth Observing System (GEOS) atmospheric model, with 7-km horizontal grid spacing and 72 vertical layers, coupled to a LLC2160 configuration of the Massachusetts Institute of Technology general circulation model (MITgcm) with 2–4-km grid spacing and 90 vertical levels. The ocean model includes tidal forcing. The C1440-LLC2160 simulation has been integrated for 14 months, starting from prescribed initial conditions on January 20, 2020; the first 40 days were submitted to the DYnamics of the Atmospheric general circulation Modeled On Non-hydrostatic Domains (DYAMOND) intercomparison project. Hourly atmospheric and oceanic model output of all model variables is being made available to the scientific community. This "nature" simulation provides a unique synthetic dataset for atmospheric and oceanic boundary layer studies and for satellite and in-situ observing system design.
NASA’s high-performance computing resources, including data storage and visualization of the results by the NAS visualization team, have been key to carrying out this simulation and will enable its analysis.
Results and Impact
The kilometer-scale ocean-atmosphere simulation was just completed, and analysis of the model output is getting started. This is a unique, first-of-its-kind simulation in its resolution, inclusion of oceanic tidal forcing, duration, and frequency of model output. In an early study, we focused on recurring intermittent wind events in the Gulf Stream region. These events were found to induce local air-sea heat fluxes above sea surface temperature (SST) anomalies with horizontal scales smaller than 500 km. Particularly, strong latent heat bursts above warm SST anomalies are observed during these wind events. We further show that such wind events are associated with a secondary circulation above warm SST anomalies that fuels the latent heat bursts by transferring warm and dry air, and momentum from the upper levels, down to the sea surface. The relationship between the intensity of this secondary circulation and the strength of small-scale SST fronts that border SST anomalies indicates that such air-sea interaction phenomena require high-resolution capabilities in both the model's atmospheric and oceanic components, as has been achieved here.
Why HPC Matters
This simulation required nearly a full year of computation on nearly 9,000 cores of the Pleiades and Aitken supercomputers at the NASA Advanced Supercomputing facility and produced close to two petabytes of model output. NASA’s high-performance computing resources, including data storage and visualization of the results by the NAS visualization team, have been key to carrying out this simulation and will enable its analysis.
What's Next
The key next steps are to continue distribution of the simulation results to scientists who want to use them and to continue the analysis. This simulation is a stepping stone towards an even higher-resolution simulation that explicitly represents ice shelf cavities and the ocean carbon cycle.
More Information
Researchers
- Dimitris Menemenlis, NASA Jet Propulsion Laboratory Please enable Javascript to see email address.
- Andrea Molod, NASA Goddard Space Flight Center Please enable Javascript to see email address.
- Christopher Henze, NASA Ames Research Center Please enable Javascript to see email address.
- Christopher Hill, Massachusetts Institute of Technology Please enable Javascript to see email address.