
Ensuring Safe Passage of the Space Launch System Through the Speed of Sound
Overview
During the ascent flight phase of the Space Launch System (SLS), NASA’s next heavy-lift launch rocket, the vehicle may encounter flow-induced oscillatory (side-to-side) buffet on the vehicle caused by the interactions of the shock and airflow wake near the speed of sound (transonic conditions). If these forces exceed predicted design loads, this buffeting can excite structural harmonic frequencies that can lead to catastrophic loss of the vehicle. Due to advances in algorithms and high-end computing, computational fluid dynamics (CFD) simulations can now provide data that can be obtained earlier in the design cycle than experimental data resulting from wind tunnel tests, but the accuracy of such data needs to be verified. In this study, we used a variety of analyses to evaluate computational data accuracy and help develop new tools to aid in the successful and safe operation of NASA’s next generation space flight vehicle.
Project Details
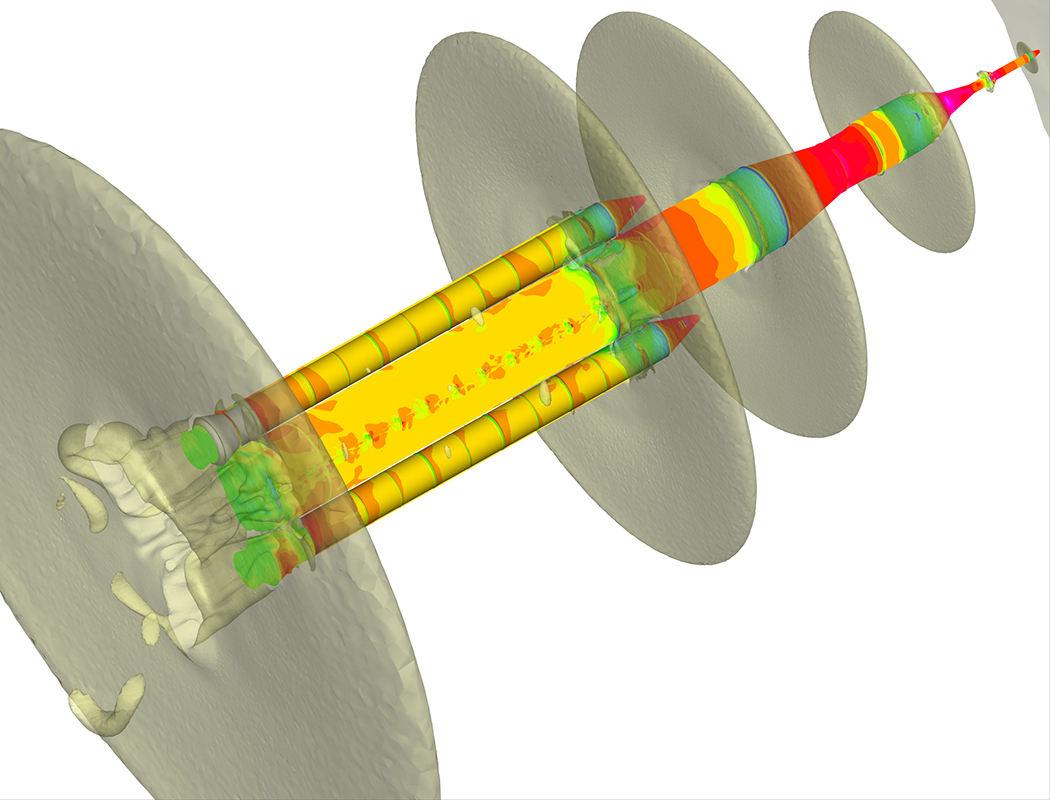
We used CFD simulations of transonic flight conditions to predict the time-varying surface pressures and resulting oscillatory forces. Comparisons to experimental wind tunnel data showed good agreement with the peak root-mean-square (RMS) location, positioned just aft of the forward booster attach hardware, with dominant frequency at that location predicted within 20% of accuracy. Using a delayed detached eddy simulation (DDES) model, we computed the unsteady flow around the entire SLS vehicle during ascent. Surface-pressure time histories were monitored at over 600 locations on the SLS and compared to experimental data from tests performed at the NASA Langley Transonic Dynamics Tunnel in Virginia and the NASA Ames Unitary Plan Wind Tunnel in California.
To quantify the accuracy of computed data, we performed sensitivity studies of computational mesh density and time step size. The RMS of pressure coefficients (Cprms), histograms of surface pressures, power spectral densities (PSD) of surface pressures, and coherence analyses were performed to determine the required computational time in order to achieve the desired solution accuracy.
Results and Impact
- Regions of elevated Cprms associated with high buffet loads were identified by the CFD simulations, and match locations from wind tunnel tests.
- Comparisons of computational and experimental Cp histograms show similar trends, indicating the simulations are capturing the physical phenomena in the flow field.
- Comparisons of computational and experimental PSDs show that frequency content is similar, but not exactly the same.
- CFD models were used to investigate the ability of alternate booster noses to reduce Cprms levels, with results corroborated by wind tunnel data.
- PSD analyses show that 0.5-0.8 second of simulated data is sufficient to resolve oscillatory forces on the SLS for the computed transonic cases.
- Coherence analyses show that 1 second of simulated data is necessary to correlate the unsteady pressures along the longitudinal axis of the SLS.
Why HPC Matters
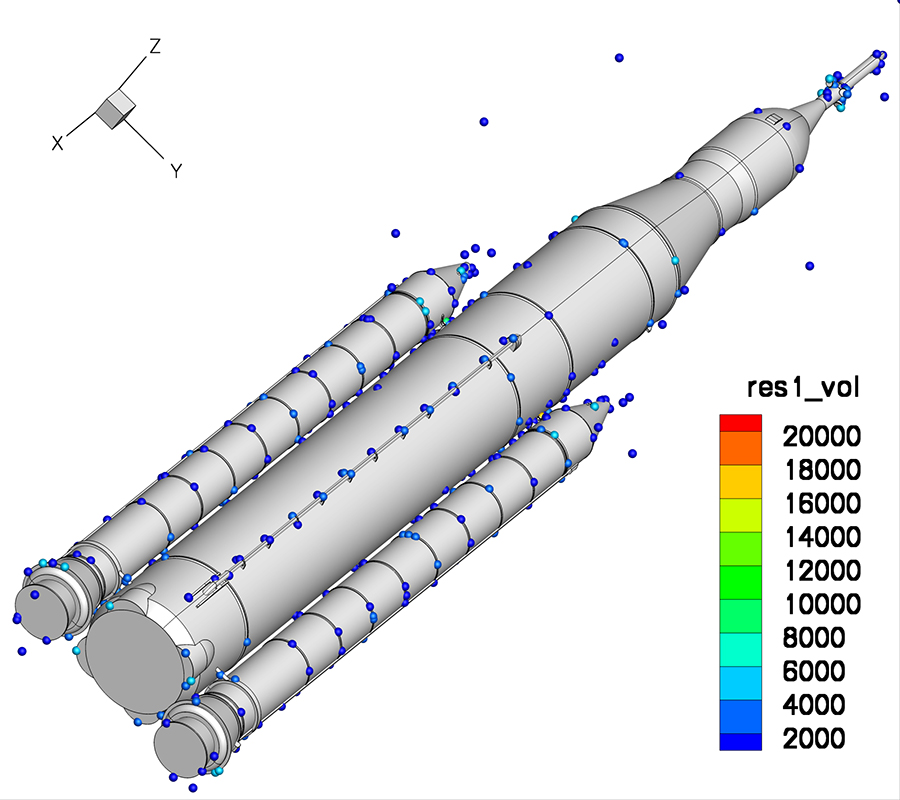
Computational predictions must be obtained in a timely manner, if the detailed information that CFD provides is to affect the vehicle design early in the program. The meshes required for DDES simulations of the SLS ranged from 35 million points to nearly 300 million points. The Fully Unstructured Navier-Stokes Three-Dimensional (FUN3D) solver enables the acquisition of this data, through the use of thousands of cores, without adversely affecting computational performance. Only high-performance systems such as the Pleiades supercomputer at the NASA Advanced Supercomputing (NAS) facility enable these types of computations, which have significantly contributed to the successful design of NASA’s SLS.
Stephen Alter, NASA Langley Research Centerstephen.j.alter@nasa.gov Greg Brauckmann, NASA Langley Research Center
gregory.j.brauckmann@nasa.gov