
Tree Census from Space: Quantifying Woody Biomass Using Machine Learning
Overview
NASA scientists are determining the woody carbon content of discrete trees in the arid and semi-arid zones south of the Sahara Desert in Africa, regions that provide early indicators of climate change’s full effects. They are mapping individual-tree crown area and determining heights for any tree or bush with an area of two square meters or more.
Project Details
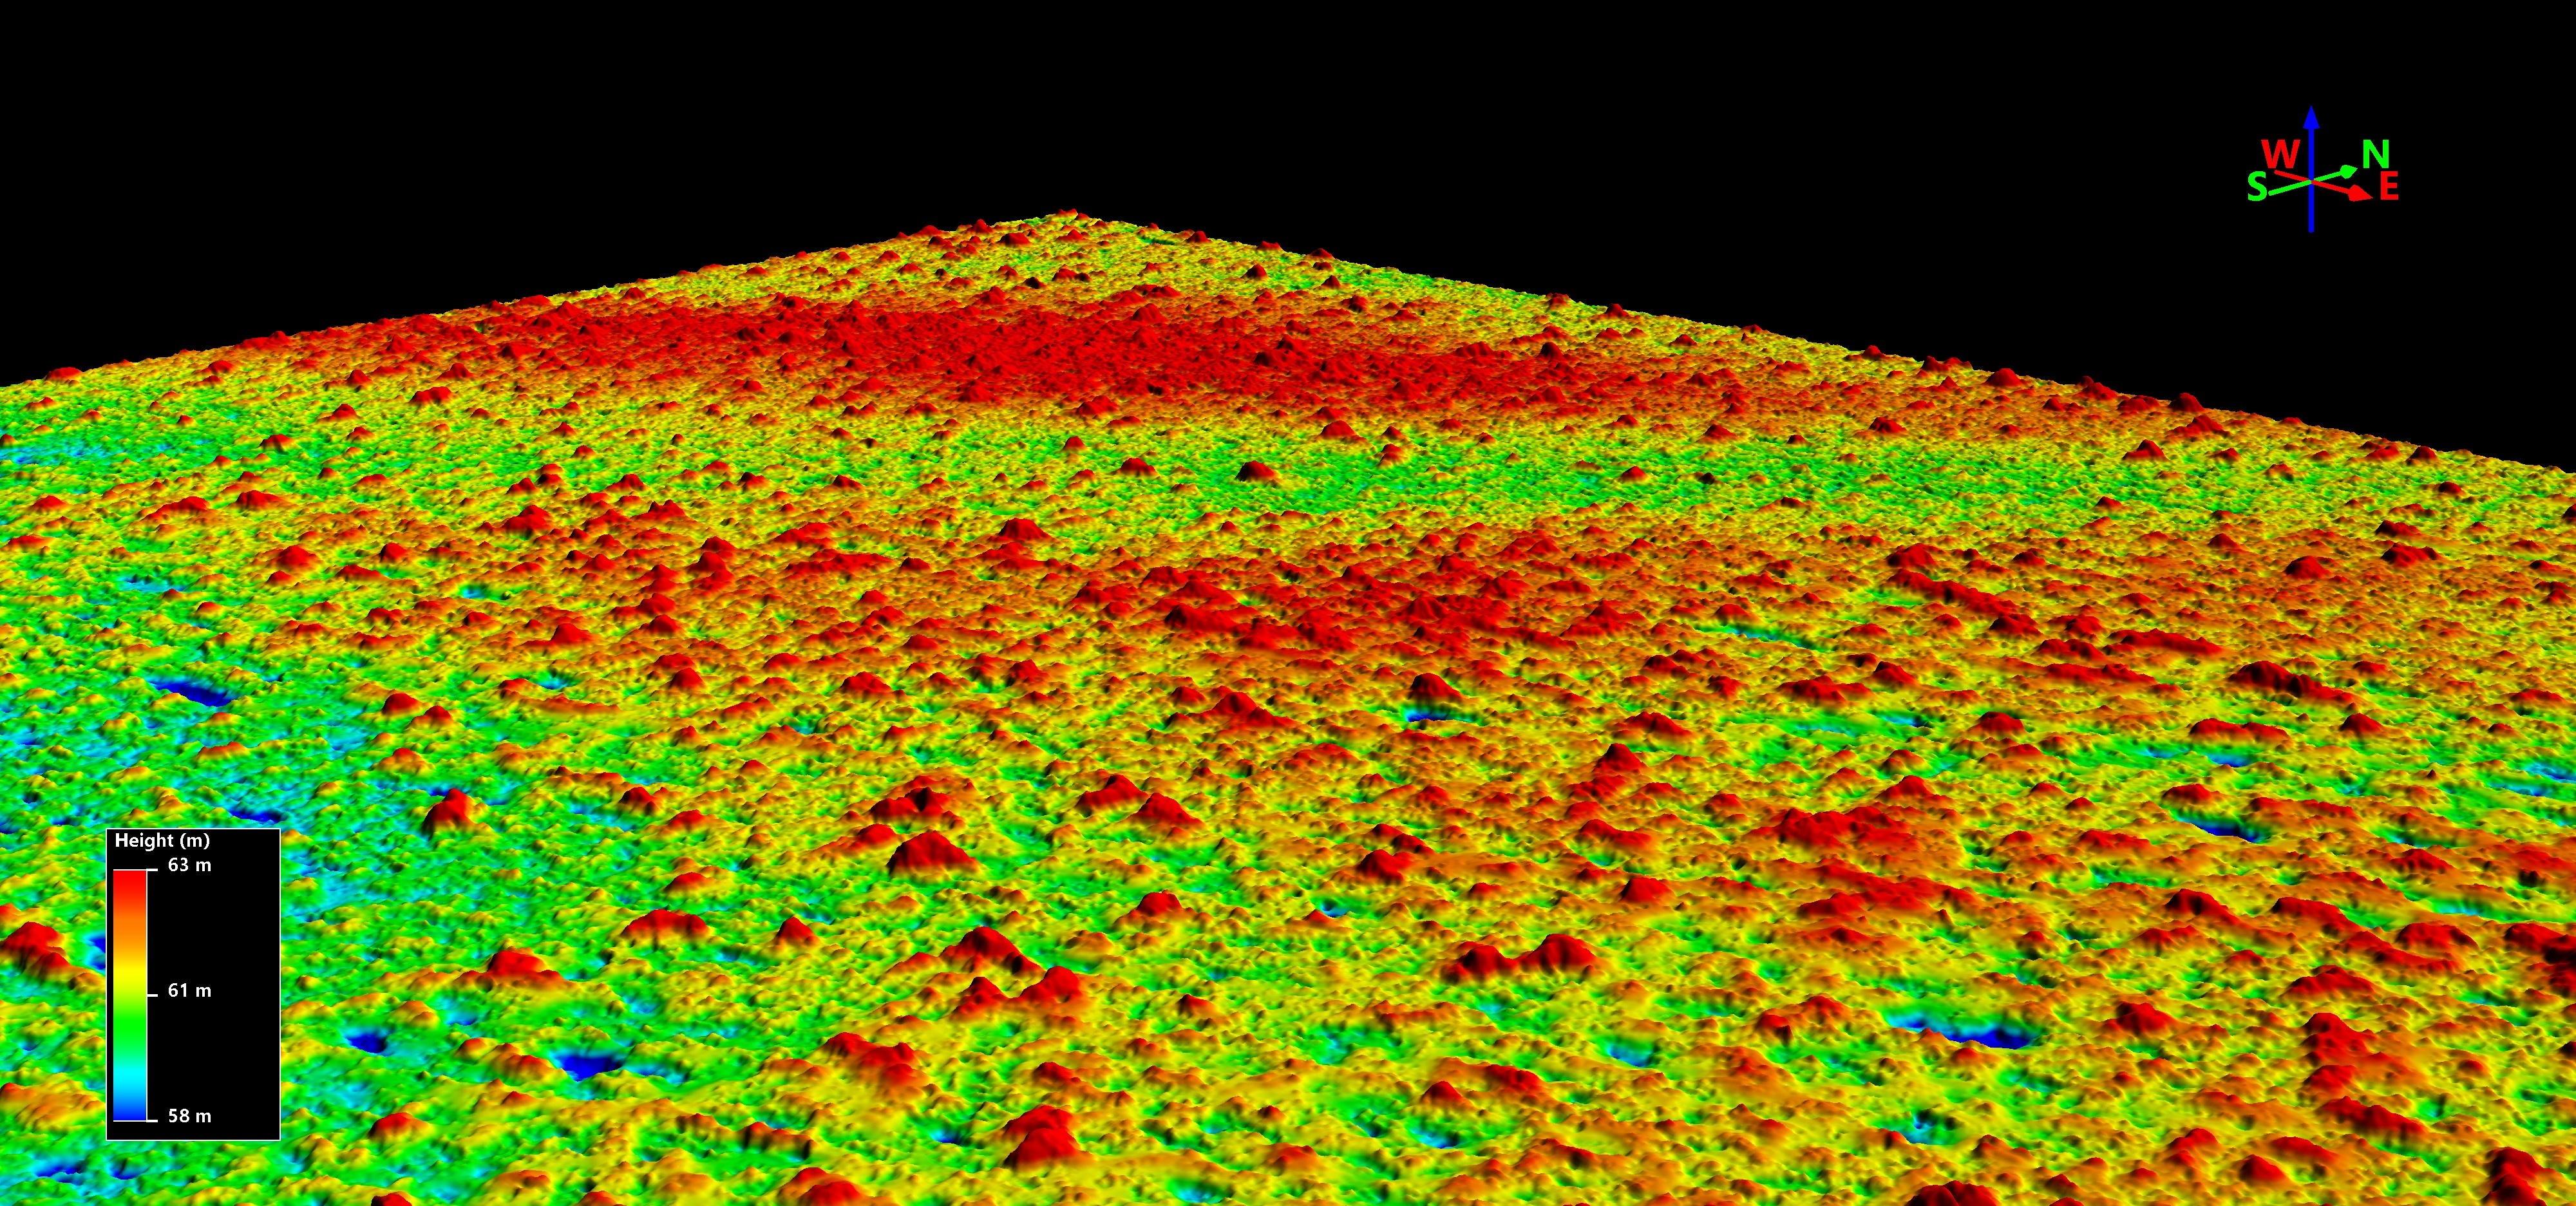
The goal of this project is to quantify the woody biomass (amount of carbon) in the trees and bushes in the hot dry tropical, arid, and semi-arid regions of Sub-Saharan Africa, an area of 10 million square kilometers.
We used hundreds of thousands of visible and near-infrared high-resolution images from four different DigitalGlobe satellites. These images are accessed through the NextView License for NASA’s scientific research and have a resolution of approximately 50 centimeters per pixel. To reduce any multiple counting of tree pixels, the images are first orthorectified and then mosaicked using Python and GDAL to create panchromatic and NDVI mosaics.
Once the mosaics are completed, training data are compiled from multiple sites across Africa. Machine learning (ML) then delineates trees by outlining the tree canopies and producing shapefiles of the tree canopies in question. The execution of the ML approach uses a large amount of compute resources.
Results and Impact
Initial results for the first UTM zone on the Sub-Saharan West Coast have shown that a highly accurate canopy mapping of trees is possible, with hundreds of millions of individual trees identified and their crown areas determined. Previous tree-mapping efforts with lower resolution have greatly underestimated the number of individual trees.
It is important to understand how biomass measurements of the Earth change over time, because this information can be related to changing climatic conditions. The world’s arid and semi-arid regions respond quickly to changes in climate. Because of the low density of trees in arid and semi-arid regions, changes in these areas are more easily quantified.
Why HPC Matters
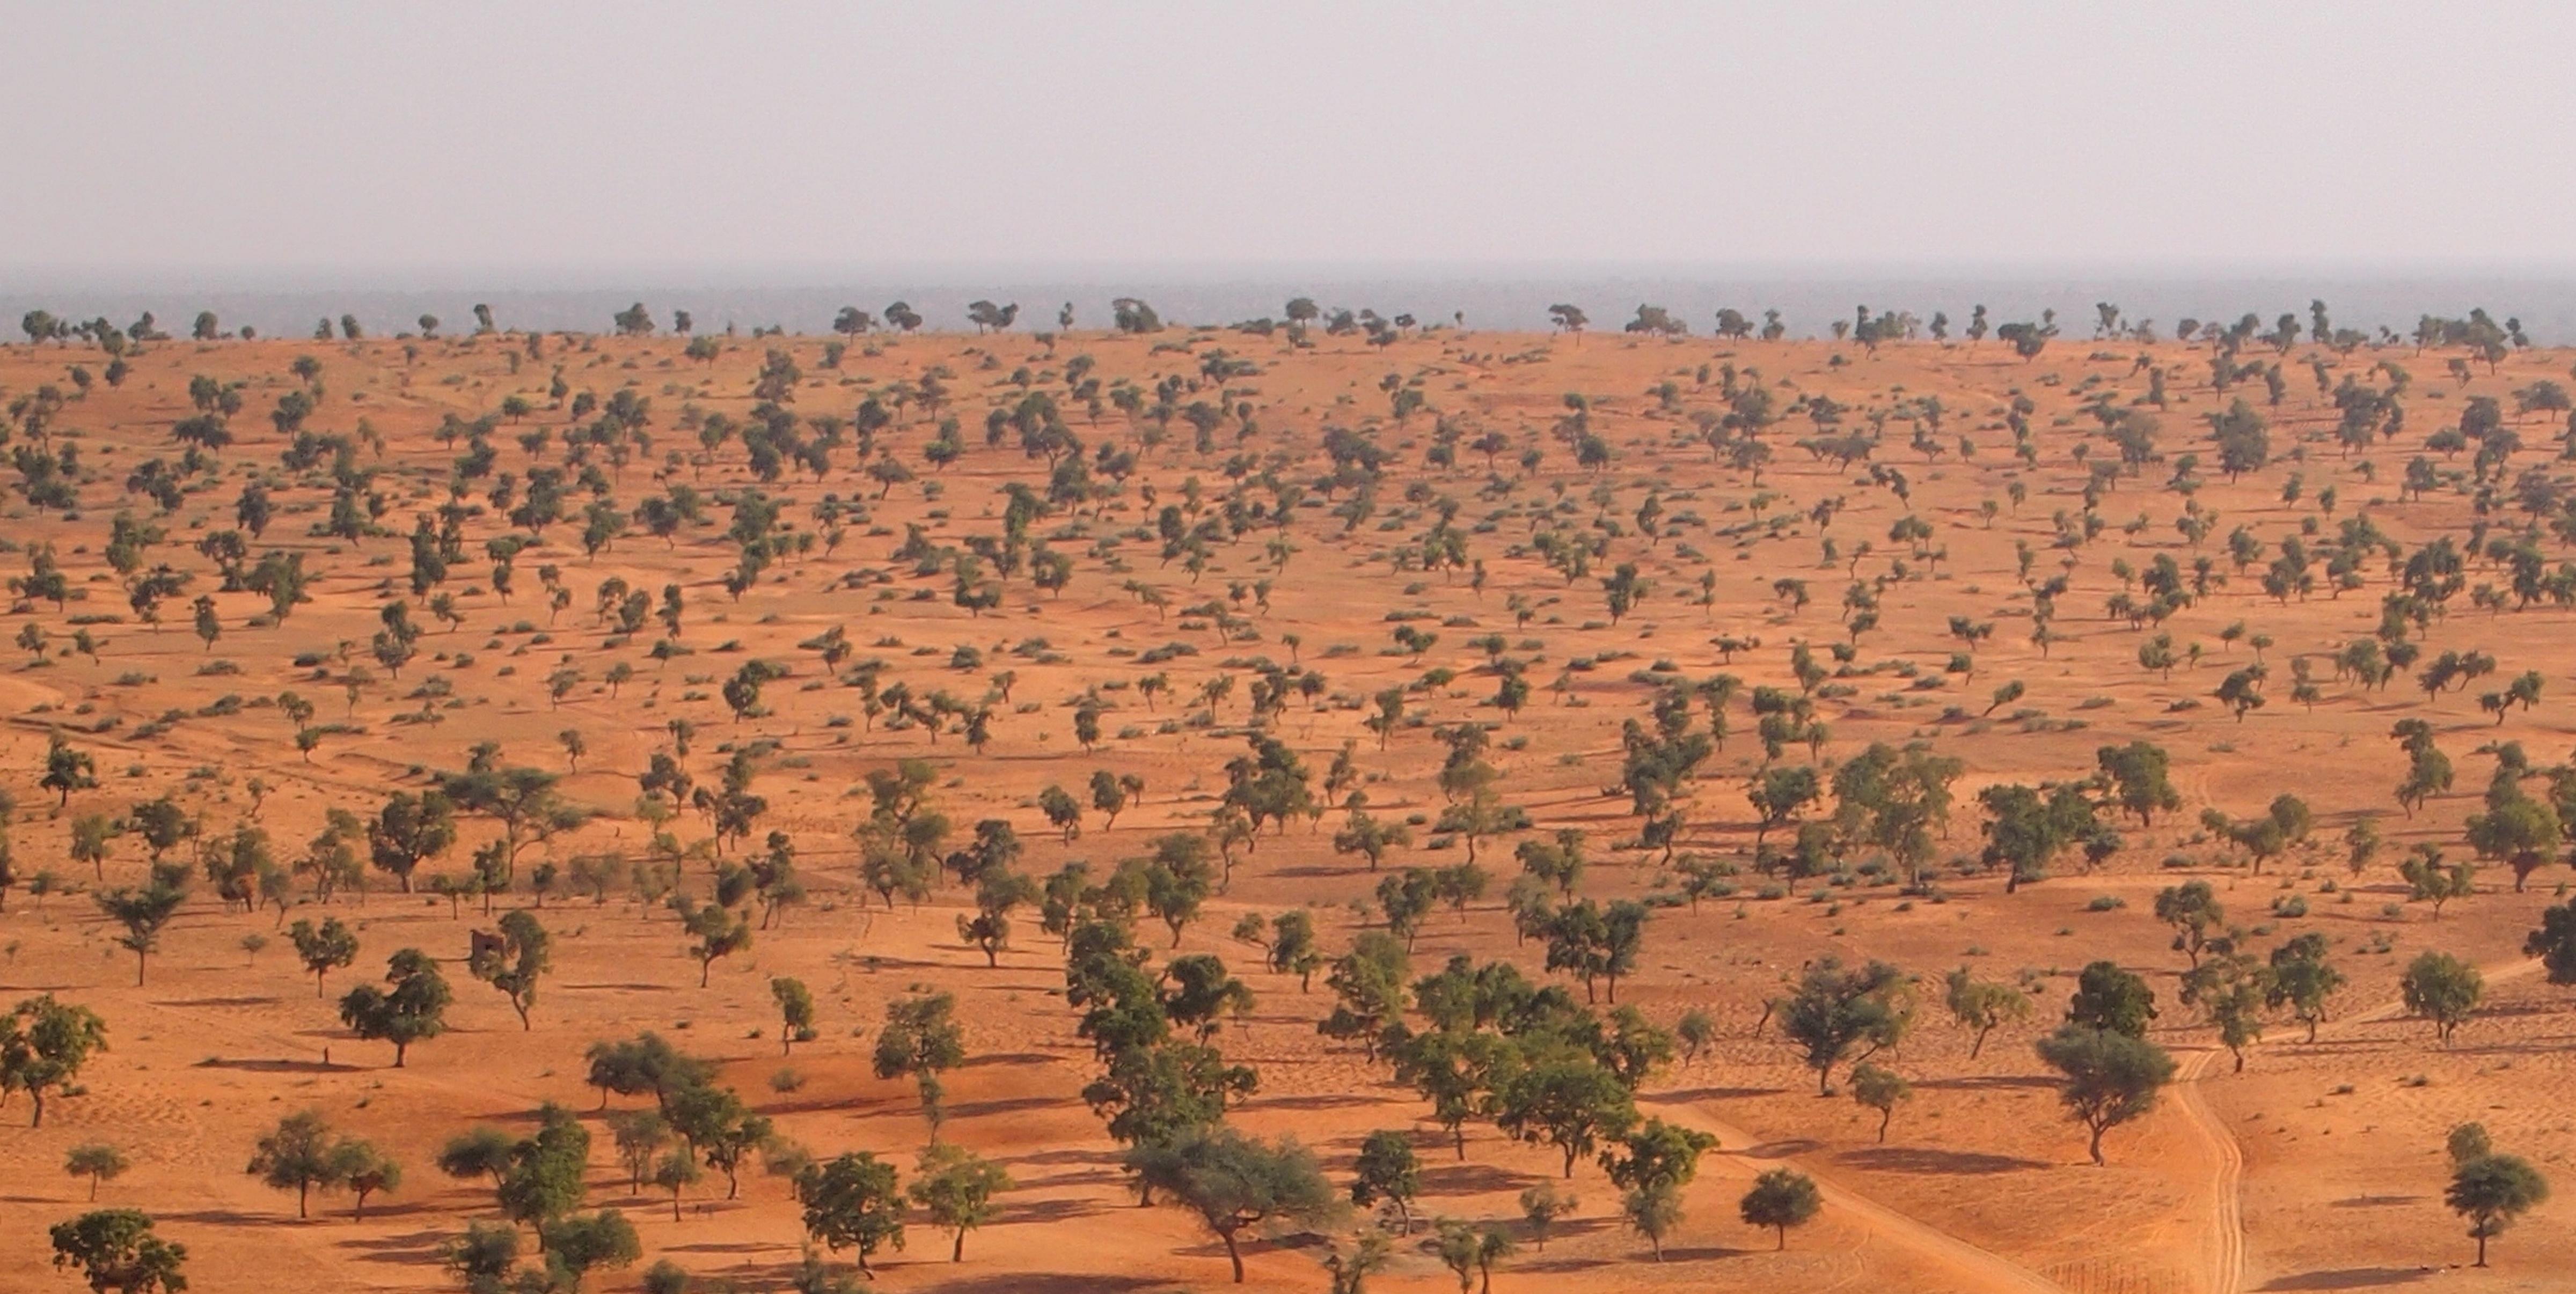
Creating the mosaics requires substantial compute and storage resources: this is why the NASA Center for Climate Simulation’s Advanced Data Analytics Platform (ADAPT) was ideal for this portion of the work. Virtual machines with specialized software stacks connected to a high-performance computing (HPC) file system (IBM Spectrum Scale cluster) take massive amounts of raw images as input and create output data for analysis. The output data are a three-dimensional array of 2.3x1,013 elements.
Analysis at such a massive scale requires substantial HPC resources. This project leverages an innovative combination of using ADAPT to build the mosaics and train the model, while using the Discover supercomputer to run the trained model that, in turn, identifies tree canopies.
What's Next
Researchers will produce a census of all trees across the entirety of Sub-Saharan Africa—from 12 degrees north latitude to 24 degrees north latitude, from the Atlantic Ocean to the Red Sea—using satellite data and ML. Stereo data will be used to estimate tree heights. These two measurements will provide an estimate of the total amount of carbon in woody biomass over this large region of the African continent. By analyzing data from multiple years, it will be possible to calculate changes in biomass over the past decade and link these to the changing, abiotic aspects of climate.
More Information
- Counting Trees and Shrubs in the Sub-Sahara Using Cloud Computing
- Achieving Expansive Biomass Estimates with Cloud Bursting
- See the poster for this demonstration (PDF, 619KB). As shown in the NASA booth at SC19.
compton.j.tucker@nasa.gov Katherine Melocik, NASA Goddard Space Flight Center
katherine.a.melocick@nasa.gov